Fig. 1
Download original image
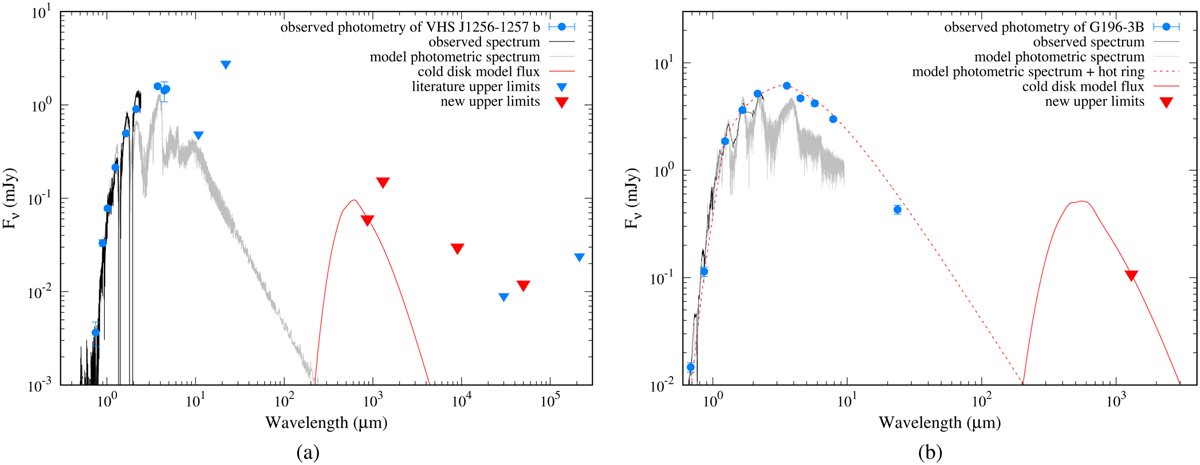
Observed spectral energy distributions (SEDs) of the substellar companions VHS J1256–1257 b (left panel) and G196-3 B (right panel) are shown with blue circles (measured photometry), triangles (flux upper limits), and black lines (observed optical and near-infrared spectra). The new 3-σ flux upper limits on the NOEMA, ALMA, and VLA data reported here are displayed in red color. The theoretical BT-Settl photospheric spectrum corresponding to the Teff of each target is shown with the solid gray line (Allard et al. 2003, 2012). In the right panel, we also illustrate with the dotted line the best model (photosphere and the hot ring) derived for G196-3 B by Zakhozhay et al. (2017). The solid red line stands for the SEDs of putative cold dusty disks computed as explained in the text.
Current usage metrics show cumulative count of Article Views (full-text article views including HTML views, PDF and ePub downloads, according to the available data) and Abstracts Views on Vision4Press platform.
Data correspond to usage on the plateform after 2015. The current usage metrics is available 48-96 hours after online publication and is updated daily on week days.
Initial download of the metrics may take a while.