| Issue |
A&A
Volume 674, June 2023
|
|
|---|---|---|
| Article Number | A92 | |
| Number of page(s) | 15 | |
| Section | Stellar structure and evolution | |
| DOI | https://doi.org/10.1051/0004-6361/202245665 | |
| Published online | 06 June 2023 | |
The evolutionary properties of the blue loop under the influence of rapid rotation and low metallicity
1
College of Physics, Guizhou University, Guiyang, Guizhou 550025, PR China
e-mail: hfsong@gzu.edu.cn
2
Geneva Observatory, Geneva University, 1290 Sauverny, Switzerland
e-mail: georges.meynet@unige.ch
3
College of Physics, Henan Normal University, Xinxiang, Henan 453007, PR China
4
Department of Physics, Anhui Normal University, Wuhu, Anhui 241000, PR China
Received:
12
December
2022
Accepted:
14
April
2023
Context. The physical mechanism leading to the formation of the blue loop in the Hertzsprung–Russell (HR) diagram is not satisfactorily explained by the evolutionary track of single stars. Rapid rotation and low metallicity drastically modify the internal structures and surface compositions of stars. Therefore, they provide a very significant pattern to investigate the evolutionary properties of the blue loop.
Aims. In this paper, we mainly explore how rapid rotation and low metallicity have an important impact on the occurrence and extension of the blue loop.
Methods. To this end, we implemented the rotating stellar evolution model, including the angular momentum transportation and chemical element mixing. We incorporated several initial rotational velocities and two characteristic metallicities in various models to explore the blue loop extension.
Results. The blue loop can occur when the hydrogen burning shell merges with the hydrogen–helium abundance discontinuity. We find that the blue loop extension strongly depends on the amplitude and gradient of the hydrogen–helium discontinuity. The hydrogen–helium discontinuity is created by the intermediate convective region or the convective dredge-up. A steeper hydrogen gradient in association with a greater amplitude of the hydrogen abundance discontinuity may favour a hotter star.
Conclusions. Both the low metallicity and rapid rotation tend to restrain the development of the outer convective envelope and thus disfavour the occurrence and extension of the blue loop. There are three main reasons for this occurrence. Firstly, the helium core and its core potential can be enlarged by rotational mixing or low metallicity. Secondly, rapid rotation reduces the convective dredge-up depth in the star with Z = 0.014 and the mass extension of the intermediate convective region in the star with Z = 0.0008. Both of these phenomena lead to a reduction of the amplitude of the hydrogen abundance gradient. Thirdly, strong rotational mixing in the model (i.e. vini = 350 km s−1) with Z = 0.0008 reduces the energy generation rate from the hydrogen burning shell. Without bending towards higher effective temperature in the HR diagram, the additional helium brought near the H-burning shell associated with the larger He core can cause the star to expand towards becoming a red giant star directly after the core hydrogen burning. Rapid rotation and low metallicity tend to produce surface enrichment of the ratio of nitrogen to carbon and reduce the 12C left in the core; this has an important influence on the stellar compactness of the supernovae progenitor.
Key words: stars: evolution / stars: massive / stars: rotation / stars: abundances / stars: interiors
© The Authors 2023
 Open Access article, published by EDP Sciences, under the terms of the Creative Commons Attribution License (https://creativecommons.org/licenses/by/4.0), which permits unrestricted use, distribution, and reproduction in any medium, provided the original work is properly cited.
This article is published in open access under the Subscribe to Open model. Subscribe to A&A to support open access publication.
1. Introduction
The blue loop is derived from the shape of the evolutionary track on the Hertzsprung–Russell (HR) diagram, which forms a loop towards the blue (i.e. hotter) side of the diagram. The evolutionary feature of the blue loop is an important evolutionary stage during the lifetime of an evolved star; this is where its surface temperature increases significantly before cooling again. Blue loops may occur in stars such as red supergiants, red giant branch stars, and asymptotic giant branch stars. Some stars may experience more than one blue loop stage. Many pulsating variable stars, such as classical Cepheids, are on the blue loop. The blue loop happens far too slowly to be observed for single stars, but it can be inferred from theoretical investigation and from the properties and distribution of stars on the HR diagram.
So far, the physical mechanism behind the generation of the blue loop is still highly controversial. The occurrence of the blue loop during the central He-burning phase was first thoroughly investigated by Lauterborn et al. (1971), who introduced the core potential Φc = Mcore/Rcore to serve as the generation condition. However, many investigators have also shown that the proximity of the hydrogen burning shell to the hydrogen–helium discontinuity produced by the convective depth of the first dredge up can induce the blue loop (Lauterborn et al. 1971; Robertson 1972; Stothers & Chin 1991). Some researchers suggest that the evolutionary characteristics of the blue loop may depend on several important physical factors, such as the 14N(p, γ)15O reaction rate (Weiss et al. 2005; Halabi et al. 2012), and the 12C(α, γ)16O reaction rate (Iben 1966; Bertelli et al. 1985; Brunish & Becker 1990). The higher energy generation rate reduces the necessary temperature in the core and therefore the size of the core, which favours the generation of the blue loops (Maeder 2009). However, the most likely physical mechanisms leading to this loop are the efficiency of mixing in the convective core (Bertelli et al. 1985; Wagle et al. 2019, 2020), mixing below the convective envelope (Alongi et al. 1991; Godart et al. 2013; Tang et al. 2014, 2016), mass loss, and the radiation-dominated outer envelope (Meynet et al. 2015; Xu & Li 2004a,b).
The blue loop of the intermediate-mass stars during core helium burning heavily depends on the initial physical parameters, such as stellar mass, convective overshooting, metallicity, and rotation. In particular, the effect of rotation on the blue loop has not been investigated in detail. Moreover, many of the stars that experience the blue loop are B-type ones. B-type stars are generally believed to have rapid rotation (Huang et al. 2010). Anderson et al. (2014) claimed that the typical rotational velocities of B-stars on the main sequence in the mass range appropriate for classical Cepheids is approximatively v/vcrit = 0.35 ± 0.05, where the quantity vcrit represents the break-up rotational velocity. Rapid rotation can make the centrifugal force modify the hydrostatic equilibrium. Moreover, rapid rotation can greatly modify the evolutionary track of the star by inducing additional efficient mixing effects that alter the main sequence lifetime, stellar core mass or size, the profile of chemical species, evolutionary age, and surface chemical element abundance (Maeder & Meynet 2012; Langer 2012; Heger & Langer 2000; Song et al. 2013, 2016). These effects undoubtedly have important effects on the evolution of the blue loop.
In this paper, we investigate how single-star evolution produces a blue loop when considering the effects of rotation and metallicity. We mainly focus on the physical mechanism behind the occurrence and extension of the blue loop, and explore the prediction made by the theoretical model in detail. We discuss the following questions in the single-star evolution scenario: (1) how some initial physical parameters (i.e. initial rotational velocities and metallicity) have an important impact on the occurrence and extension of the blue loop; (2) how the surface chemical abundance varies with these initial parameters; and (3) how the internal structure of the whole star is influenced by these initial parameters.
In Sect. 2, we briefly describe the physical equations and the domain of initial conditions that we explore in this work. In Sect. 3, the results of numerical calculations for the evolution of single stars and binary systems are presented in detail. Conclusions and a summary of our findings are given in Sect. 4.
2. The initial parameters and model descriptions
2.1. Transport of angular momentum
In this work, we employ the Roche model, which includes the effect of the centrifugal force and the shellular hypothesis presented by Zahn (1992) and Maeder & Zahn (1998). We consider various instabilities produced by rotation that result in the transport of angular momentum and mixing of chemical elements: Eddington-Sweet circulation, dynamical and secular shear instability, and the Goldreich-Schubert-Fricke instability (Endal & Sofia 1978; Pinsonneault et al. 1989; Maeder & Meynet 2000). The coefficient of horizontal turbulence is derived by Zahn (1992) and the shear diffusion coefficient is used from Maeder (1997). Both of these coefficients were calibrated based on the fact that the average surface enrichment of main sequence B-type stars at solar metallicity has to correspond with the mean observed velocity. The transport equation for the angular momentum inside a star is implemented following the prescription of Zahn (1992). This prescription was also complemented by Talon & Zahn (1997) and Maeder & Zahn (1998). In the radial direction, the angular momentum transport that follows an advection–diffusion equation is treated in Lagrangian coordinates. It can be given by
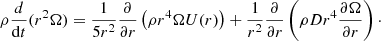
The first term on the right-hand side of the above equation is the divergence of the advected flux of angular momentum, while the second term is the divergence of the diffused flux. r is the radius, ρ denotes the density, the coefficient D is the total diffusion coefficient in the vertical direction. Taking into account the various instabilities that transport angular momentum, D = Dshear + Dconv. U(r) is the radial component of the velocity due to meridional circulation and can be expressed as
![$$ \begin{aligned} U(r)=\frac{P}{C_{\rm P}\rho Tg\left[\nabla _{\rm ad}-\nabla +\frac{\varphi }{\delta }\nabla _{\mu }\right]} \left[\frac{L}{M}(E_{\Omega }+E_{\mu })+\frac{C_{\rm P}T}{\delta }\frac{\partial \Theta }{\partial t}\right], \end{aligned} $$](/articles/aa/full_html/2023/06/aa45665-22/aa45665-22-eq2.gif)
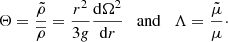
where  is the effective mass, L is the luminosity, P is the pressure, T is the temperature, CP is the specific heat at constant pressure, and ∇, ∇μ, and ∇ad are the radiative, adiabatic, and mean molecular weight gradients, respectively (Maeder & Zahn 1998). Also, g is the effective gravity and, as defined by
 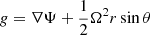 ,
,  and
and 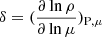 are parameters derived from the equation of state. The effects of expansion or contraction are automatically included in the Lagrangian treatment. The factors EΩ and Eμ in the above equation are closely related to the rotational profile, and the mean molecular weight in Maeder (2009) is adopted:
![$$ \begin{aligned} E_{\Omega } =&2 \left[1-\frac{\overline{\Omega ^{2}}}{2 \pi G \overline{\rho }}-\frac{(\overline{\varepsilon }+\overline{\varepsilon }^\mathrm{grav})}{\varepsilon _{\rm m}}\right]\frac{\tilde{g}}{\overline{g}}\\&- \frac{\rho _{\rm m}}{\overline{\rho }} \left\{ \frac{r}{3}\frac{d}{\mathrm{d}r}\left[H_{\rm T} \frac{d}{\mathrm{d}r} \frac{\Theta }{\delta } -\chi _{\rm T} \frac{\Theta }{\delta } + 1-\frac{1}{\delta } \Theta \right]\right. \nonumber \\& - \left. \frac{2H_{\rm T}}{r} \left( 1+\frac{D_{\rm h}}{K} \right)\frac{\Theta }{\delta } + \frac{2}{3}\Theta \right\} \nonumber \\& - \frac{(\overline{\varepsilon }+\overline{\varepsilon }^\mathrm{grav})}{\varepsilon _{\rm m}} \left[H_{\rm T} \frac{d}{\mathrm{d}r} \frac{\Theta }{\delta } + (f_{\varepsilon }\varepsilon _{\rm T}-\chi _{\rm T}) \frac{\Theta }{\delta }\right. \nonumber \\& + \left. 2-f_{\varepsilon }-\frac{1}{\delta } \Theta \right]\nonumber \end{aligned} $$](/articles/aa/full_html/2023/06/aa45665-22/aa45665-22-eq7.gif)
and
![$$ \begin{aligned} E_{\mu } =&\frac{\rho _{\rm m}}{\overline{\rho }} \left\{ \frac{r}{3}\frac{d}{\mathrm{d}r}\left[H_{\rm T} \frac{d}{\mathrm{d}r} \frac{\varphi }{\delta } \Lambda -\left(\chi _{\mu } + \frac{\varphi }{\delta } \chi _{\rm T}+\frac{\varphi }{\delta }\right) \Lambda \right] \right.\nonumber \\&- \left. \frac{2H_{\rm T}}{r} \frac{\varphi }{\delta } \Lambda \right\} \nonumber \\&+ \frac{(\overline{\varepsilon }+\overline{\varepsilon }^\mathrm{grav})}{\varepsilon _{\rm m}} \left[H_{\rm T} \frac{d}{\mathrm{d}r} \frac{\varphi }{\delta } \Lambda + f_{\varepsilon }\left(\varepsilon _{\rm T} + \frac{\varphi }{\delta } \varepsilon _{\mu }\right)-\chi _{\mu }\right.\nonumber \\&- \left. \frac{\varphi }{\delta } (\chi _{\rm T}+1)\Lambda \right], \end{aligned} $$](/articles/aa/full_html/2023/06/aa45665-22/aa45665-22-eq8.gif)
where HT represents the scale height of the temperature, K is the thermal diffusivity, 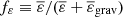 , where
  and
and  are the mean nuclear and gravitational energy, respectively. Also, χμ and εμ are logarithmic derivatives of the radiative conductivity χ and the total energy ε with respect to μ, and the derivatives with respect to T are denoted χT and εT. Here, εm(r)≡L(r)/M(r) and ρm is the mean density inside the considered level surface. Dh is the horizontal diffusion coefficient, and Θ and Λ are the relative variations over an isobar of density and mean molecular weight respectively, with
2.2. Transport of chemical species
The transportation of the chemical species for a given element Yi in the shell with coordinate r is (Zahn 1992)
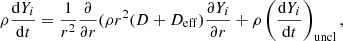
where D is the same as in Eq. (1). The last term accounts for the change in abundances produced by nuclear reactions. Chaboyer & Zahn (1992) have shown that the horizontal turbulence competes efficiently with the advective term of the meridional circulation. The horizontal flow tends to homogenise the layer in such a way that the transport of chemical species by both meridional circulation and horizontal turbulence can be computed as a diffusive process with coefficient Dh (Maeder 1997).
2.3. Transport of energy
The energy equation is given by
where ϵnuc is the rate of local thermonuclear energy generation per unit mass (i.e. ϵnuc has units of erg g−1 s−1), ϵν is the rate of energy escape from the stellar material per unit mass in neutrinos, and stellar expansion and contraction can be calculated as (Kippenhahn & Weigert 1990)
The stellar material that deviates from adiabaticity during contraction or expansion leads to energy release and this energy can be expressed as

where Lnuc is the total nuclear luminosity, Lν denotes the neutrino luminosity, which may be neglected during the core helium burning, LH is the luminosity that comes from the hydrogen burning shell, and LHe represents the luminosity that comes from the core helium burning. For an expanding star (i.e. Lg < 0), the actual surface luminosity Ls is smaller than the total nuclear luminosity Lnuc, which is the second item on the right hand of Eq. (9). For a contracting star (i.e. Lg > 0), the situation is reversed. Therefore, the blue loop is actually determined by two terms on the right-hand side of Eq. (9). For a homologous expansion and contraction, the luminosity Lg can be approximately given by
![$$ \begin{aligned} L_{\rm g} = -q\frac{GM^{2}}{R^{2}}\left[\frac{\Gamma _{1}-4/3}{\Gamma _{3}-1}\right]\frac{\mathrm{d}R}{\mathrm{d}t}, \end{aligned} $$](/articles/aa/full_html/2023/06/aa45665-22/aa45665-22-eq17.gif)
where the gravitational energy  , q is a dimensionless constant, and the factors Γ1 and Γ3 are adiabatic exponents.
2.4. The initial parameters
An overshooting parameter αover = 0.1 is employed in this paper, which starts from the Schwarzschild limit. This parameter has been calibrated in the mass range 1.35−9 M⊙ at solar metallicity to ensure that the rotating stars can accurately reproduce the observed evolutionary width of the main sequence band. However, the overshooting process at the base of the convective envelope has not been explicitly included because a particular choice of the mixing-length parameter (i.e. αmlt = 1.6) in the outer convective envelope may implicitly produce a similar overshooting effect. The radiative wind mass-loss rate is from Langer (2012). In regions not covered by this prescription, we adopt another prescription presented in de Jager et al. (1988). For red giant stars, we adopted the wind formula derived by Reimers (1975, 1977) for stars up to 12 M⊙, with η = 0.5.
We present non-rotating and rotating single-star models with various initial rotational parameters. Four initial rotational velocity values are set to be vini = 0 km s−1, vini = 120 km s−1, vini = 250 km s−1, and vini = 350 km s−1, respectively. We also focus on the evolution of the star and explore whether or not stellar evolution via different initial metallicities could give rise to diverse evolutionary results. Two different metallicity cases are adopted, namely Z = 0.0008 and Z = 0.014. In all models, we calculate the evolution at least to the end of central helium burning.
3. Results of numerical calculations
3.1. Properties of stellar evolution during the main sequence
Figure 1 shows the evolution tracks of non-rotating and rotating models with various initial rotational parameters and metallicities in the HR diagram. The evolution of a 10 M⊙ star is calculated at various initial parameters. Rotation can be seen to have an important impact on the evolution of the main sequence. More precisely, rotation can exert two main effects on the evolutionary tracks. Firstly, the centrifugal force significantly modifies the hydrostatic equilibrium from the onset of the evolution (i.e. point A) because it partly sustains the star against its gravitational force. This physical mechanism leads to a smaller core mass and stellar luminosity at the onset of evolution due to lower core pressure. Therefore, the rotating star requires higher mass in order to attain the same luminosity as its non-rotating counterpart. For example, in contrast to the model with zero rotation, the central temperature becomes lower and the corresponding central density becomes higher in the star with vini = 250 km s−1 (cf., Fig. 5). Secondly, the mixing induced by rotation can transfer fresh hydrogen from the outer envelope to the core. Therefore, the core hydrogen can be refueled and therefore the core in a rotating star can burn more hydrogen in a longer time. This mixing process can convert more hydrogen into helium from the early stage of the main sequence. As a result, rotational mixing induces a slower receding convective core during the main sequence phase in comparison with the corresponding model with zero rotation (cf., Fig. 4).
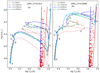 |
Fig. 1. Evolutionary tracks of the stars on the HR diagram. Panel a: for the 10 M⊙ stars with Z = 0.014 but with different initial rotational velocities, vini = 0 km s−1, 120 km s−1, 250 km s−1, 350 km s−1. Panel b: for the 10 M⊙ stars with Z = 0.0008 but with the corresponding different initial rotational velocities. The instability strip and observational data are from Bono et al. (2000), Turner & Burke (2002), Tammann et al. (2003). Point A in both panels corresponds to the position of the ZAMS and point B corresponds to the start of the overall contraction phase near the end of the main sequence (i.e. the central hydrogen mass fraction Xc ≈ 0.03). Point C corresponds to the exhaustion of hydrogen in the centre and the disappearance of the convective core and point D in the left panel implies the bottom of the Hayashi line. Point E indicates the ignition of the core helium and point F denotes the starting point of the blue loop. Point G implies the bluest location of the blue loop and point H illustrates the terminal of the blue loop. |
Moreover, the rotation-induced mixing increases the mean molecular weight μ and decreases the electron scattering opacity κ in the core. The electron scattering opacity scales as κes = 0.2(1 + X), and becomes smaller when the hydrogen mass fraction is decreased. As a result, a rapidly rotating star with vini = 350 km s−1 behaves as a more massive non-rotating star with a higher luminosity, which is scaled as  (Maeder 2009). This fact also implies that the increased luminosity by the efficient rotational mixing can drastically overwhelm the decreased luminosity produced by the centrifugal force in the stars with a higher initial rotational velocity.
We now investigate models of lower metallicity, namely with Z = 0.0008. The evolutionary tracks of the models with Z = 0.0008 and with various initial rotational velocities in the HR diagram are shown in panel b of Fig. 1. For the non-rotating model with Z = 0.0008, one can find the main difference is a lower initial helium fraction (Y = 0.2494) and a corresponding higher hydrogen abundance (i.e. X = 0.7498) in contrast to the corresponding model with Z = 0.014 (i.e. X = 0.72, Y = 0.266).
The non-rotating model with Z = 0.0008 has a lower opacity and therefore the evolutionary track shifts towards a higher effective temperature in comparison with the corresponding model with Z = 0.014 (cf., Fig. 1). The reason for this is that the envelope with a lower metallicity becomes more transparent. Generally speaking, a star of lower metallicity has a weaker nuclear reaction rate via the CNO cycle and depends strongly on pp-chains to produce its energy. The nuclear reaction via the pp-chain is much less temperature dependent than the reaction via the CNO cycle. In order to obtain a higher central temperature, the star with a lower metallicity shrinks even more sharply and becomes more compact (cf., Fig. 3). Such variation can generate a large temperature gradient inside the star. The evolution of the stellar luminosity strongly depends on the convective core, and is therefore closely related to both the central temperature and density. We also find that the convective core becomes larger with decreasing metallicity, which we conclude from the fact that the central temperature and density become higher in the star with Z = 0.0008 in comparison with the counterpart with Z = 0.014. The position of the zero-age main sequence (ZAMS) for the non-rotational model with Z = 0.0008 evidently moves to the left in the HR diagram. Therefore, both the luminosity and effective temperature are larger for the non-rotational model with Z = 0.0008 than for the corresponding model with solar metallicity at the onset of evolution.
3.2. The evolution with hydrogen shell burning as the only energy source
3.2.1. The crossing of the Hertzsprung gap
Panels a and b in Fig. 1 show the evolutionary details of the stars from the end of central hydrogen burning in the HR diagram. After point C in Fig. 1, the central core below the hydrogen burning shell shrinks, whereas the outer envelope expands rapidly due to the mirror effect. The star complies with the virial theorem as a whole during the evolution in the Hertzsprung gap (Fricke & Strittmatter 1972). The envelope temperature in the non-rotational model with Z = 0.014 falls and the corresponding opacity in the envelope goes up. This process can effectively hinder the transport of radiative energy. A significant fraction of the nuclear energy produced by the hydrogen burning shell is absorbed by the expanding envelope and this leads to a decrease in the surface luminosity between point C and point D in the non-rotational model.
In contrast to the solar metallicity model with zero rotation, one can find that rotation can effectively reduce the magnitude of the luminosity decline in the model with vini = 250 km s−1, because the opacity in the envelope can be decreased by the helium enrichment (cf., panel a in Fig. 1). This implies that less thermal energy – which can be transformed into gravitational potential – is obtained from the internal hydrogen burning shell.
The model with a lower metallicity slowly shifts towards the red supergiant phase at the end of the central helium burning phase. The timescale of the redward evolution of the star with Z = 0.0008 through the Hertzsprung gap is extremely sensitive to the extension of the intermediate convection zone1, which is linked to the hydrogen-burning shell. Furthermore, the rotation-induced mixing can bring about more helium in the zone of hydrogen burning shell. This tends to reduce the opacity and the corresponding intermediate convective region become less active and may even be nearly absent. The reduction or even absence of the intermediate convective region which is associated with the hydrogen burning shell can cause the star to expand rapidly towards the red giant branch. The density gradients are usually smaller in the convective zone, and the greater the intermediate convection zone is in mass, the more compact and blue the star is on the HR diagram. Generally, a large intermediate convective region develops and shifts the location of the hydrogen–helium discontinuity slightly deeper. The hydrogen burning shell is able to reach the hydrogen–helium discontinuity2 easily and a blue loop occurs early.
3.2.2. The evolution along the Hayashi line
As point D in panel a of Fig. 1 is approached; the outer envelope becomes convectively unstable and the convection starts from the surface. Convective motions gradually penetrate inwards into the radiative region and a large fraction of the envelope mass has become convective at point D.
After point D, the star in the model with Z = 0.014 becomes a red supergiant star with a deep convective envelope and it continues to expand in response to the core shrinkage. The luminosity of the star increases, while the effective temperature remains roughly constant, almost equivalent to the value on the Hayashi line. Stellar expansion happens on a thermal timescale and thus the duration of the phase where the only nuclear energy source is the H-burning shell is very short.
This rotation can be seen to increase this maximum luminosity because larger helium cores accelerate the core contraction, aiding the energy generation rate from hydrogen burning shells. For example, stellar luminosity reaches log L/L⊙ = 4.216 for the solar model with vini = 0 km s−1 at the tip of the red giant branch, whereas it attains log L/L⊙ = 4.284 for the model with vini = 120 km s−1. This fact indicates that the energy generation rate from hydrogen burning shells is mainly governed by the helium core mass and not by the envelope mass. Stellar luminosity is independent of total stellar mass. Most of the luminosity during the central helium burning originates from the hydrogen shell burning above the helium core. The enlarged helium core induced by rotation contracts on the thermal (or Kelvin–Helmholtz) timescale and builds up a larger temperature gradient insider the core. The temperature gradient causes an outward heat flow from the core and this can heat the hydrogen burning shell.
In comparison with the non-rotational model with solar metallicity, the amplitude of stellar expansion in the same model with Z = 0.0008 becomes smaller after the main sequence (cf., panel b in Fig. 3). The hydrostatic equilibrium position of core helium burning models in the HR diagram is extremely sensitive to hydrogen or helium profiles between the helium core and the hydrogen helium discontinuity left behind by the formation of intermediate convective regions or by the penetration of the first convective dredge-up. The region of helium excess is located at the top of the hydrogen burning shell and its helium abundance decreases steadily outwards (cf., the top left panel E of Fig. 8); it is produced as a result of the convective core shrinkage during the main sequence. Therefore, the helium excess implies that the local helium abundance is greater than the surface value and its profile demonstrates the innermost hydrogen-containing layers above the helium core. It is the helium excess above the hydrogen burning shell that may cause the stars to evolve towards lower surface effective temperature before the occurrence of the blue loop. A larger fraction of helium abundance in the hydrogen burning shell favours a hotter star. This is because the larger helium abundance significantly reduces the envelope opacity, leading to a smaller radius. The outward burning of the hydrogen shell produces helium ashes and eliminates the region of helium excess generally. The H-burning shell consumes the region of changing composition and moves towards the hydrogen–helium discontinuity left by the convective envelope at its deepest extent. This region becomes the radiative helium shell on the top inner convective core. The density and temperature gradients between the core and the envelope become shallower in the low-metallicity model with zero rotation and therefore the hydrogen burning shell still occupies a relatively large region, which is in contrast to the solar metallicity model (cf., point E in the right panels in Fig. 6). On one hand, the nuclear reaction rate via the CNO cycle becomes lower because of a lower CNO abundance in the position of the hydrogen-burning shell. On the other hand, lower CNO content may imply that the H-burning shell occurs at higher temperatures. The nuclear reaction rate may remain at approximately the same level.
3.3. The core helium burning phase
3.3.1. The evolution after the core helium ignition
When the core temperature attains ∼108 K, the central helium is ignited. It is the ignition of central helium (i.e. point E in the HR diagram) that terminates both envelope expansion and core contraction. The star reaches its local maximum radius and luminosity. After the core helium ignition at the top of the red giant branch, the outer envelope at solar metallicity shrinks in the nuclear timescale from point E to point F. Stellar luminosity reduces accordingly in response to the contraction of stellar radius, while the outer convective region fades gradually. The star evolves downwards along the Hayashi line. Ignition of the core helium occurs when the star exhibits a higher effective temperature for the non-rotational model with Z = 0.0008, which is in contrast to the model with solar metallicity. For example, the non-rotational model with solar metallicity attains the core He-burning stage at log Teff ∼ 3.635, whereas the model with Z = 0.0008 reaches this stage at log Teff ∼ 3.664. The core at Z = 0.0008 does not need to rapidly shrink in order to start burning central helium because it is already hot enough.
The luminosity from the core helium burning LHe goes up with the helium core mass and only becomes comparable to LH at the central helium exhaustion. Therefore, the luminosity coming from the He-burning core plays a secondary role in generating the subsequent blue loop, which strongly depends on LH. A higher energy generation rate from hydrogen burning shells increases the core gravitational potential because helium produced by the hydrogen burning shell increases the mass of the helium core.
3.3.2. The driving mechanism of the blue loop
The loop can be triggered only when the hydrogen burning shell attains the hydrogen helium discontinuity at a local temperature of about 2 × 10⁷ K. The shell is suddenly located in an environment with a larger hydrogen abundance (i.e. a lower mean molecular weight; cf., left panels in point F in Fig. 8). As a result, it starts to burn at a slightly lower rate, leading to a decrease in luminosity and stellar radius. This is mainly because, for a smaller molecular weight, a lower temperature and/or density is required to maintain hydrostatic equilibrium because of the equation of state. In this case, both temperature and density in the position of the hydrogen burning shell become lower. Both of these changes lead to a reduction of the nuclear energy generation rate of the hydrogen burning shell. The star goes through a local contraction when the value of LH is smaller than that of LS. The resulting blue loop can be formed. In short, the chemical profile influences the blue loop extension mainly through a hydrostatic effect.
A larger amplitude and steeper gradient of the hydrogen helium discontinuity imply that the envelope convection penetrates deeper in mass coordinates from the surface and the hydrogen–helium discontinuity will be located closer to the hydrogen shell source, favouring the formation of an extended loop. A steeper gradient of the hydrogen profile also indicates that this region has a smaller molecular weight. The hydrogen-shell source encounters a relatively high hydrogen abundance. When the local temperature exceeds 2 × 10⁷ K, the CNO burning is efficient enough to trigger the blue loop. The blue loop extension heavily depends on the hydrogen abundance profile because the chemical profile (i.e. the decrease in the function h3) entirely outweighs the increase in core potential  (Alongi et al. 1991; Godart et al. 2013; Stothers & Chin 1973, 1991; Meynet et al. 2011). Stars with a steeper hydrogen-abundance gradient are more likely to produce a bluer star, while stars that shower a shallower gradient are more likely to be redder (Walmswell et al. 2015; Schootemeijer & Langer 2018; Schootemeijer et al. 2019; Farrell et al. 2022). Walmswell et al. (2015) also claimed that the decreased mean molecular weight and increased effect of opacity associated with a steeper hydrogen gradient favour a hotter star. Therefore, the location of the hydrogen–helium discontinuity is an important factor for the occurrence and extension of blue loops.
The total gravitational potential energy transforms into the total internal energy of the star according to the virial theorem. Therefore, both the temperature and density of the H-burning shell become higher due to the envelope contraction and the luminosity of the hydrogen shell source begins to increase, indicating strengthening of the hydrogen burning shell. The energy production rate of the hydrogen burning shell becomes more efficient and the blue loop attains its bluest point G in Fig. 1.
3.3.3. The blue loop extension
From panel a in Fig. 2, one can find that rapid rotation and a low metallicity can reduce and even suppress the extension of the blue loop. We discuss this effect in the following points.
 |
Fig. 2. Effective temperature Teff as a function of central helium mass fraction Ycenter during the core helium burning. Panel a: for the 10 M⊙ stars with Z = 0.014 but with different initial rotational velocities, vini = 0 km s−1, 120 km s−1, 250 km s−1, 350 km s−1. Panel b: for the 10 M⊙ stars with Z = 0.0008 but with with the corresponding different initial rotational velocities. |
It has been found that the absence or presence of the blue loop heavily depends on the relationship between an effective core potential Φ and its critical value Φcrit (Kippenhahn et al. 2013). If the effective core potential (i.e.  ) is smaller than its critical value Φcrit, the star will trigger the blue loop; otherwise, there will be no loop.
Indeed, there is a close relationship between the core potential and the central temperature because the central temperature of a star scales as  . Therefore, the central temperature after the main sequence increases with the core potential. On one hand, the hydrogen burning shell will be heated by the increased core temperature (i.e. a larger core potential) because there is a radiative zone between the helium burning core and the H-burning shell. This can cause the temperature of the H-burning shell to increase synchronously. On the other hand, the increasing central temperature leads to expansion of the stellar core; this can cause the H-burning shell to move towards a region with a lower temperature and density and results in a decrease in the H-burning luminosity (Xu & Li 2004a). The nuclear reaction rate of the hydrogen burning shell can be simultaneously influenced by the competition of these two effects. The core temperature contributes relatively little to the nuclear luminosity of the hydrogen burning shell during the whole blue loop because the blue loop is more dependent on the nuclear reaction rate of the hydrogen burning shell. The core potential substantially acts as an indirect or a secondary cause for generating the blue loop (Kippenhahn et al. 2013; Lauterborn et al. 1971).
Rotation-induced mixing can enlarge both the core mass and the corresponding core potential  and therefore the extension of blue loops can be reduced or even suppressed, as in the role of core overshooting (cf., Fig. 1 or Fig. 3). The core potential goes up with the helium core mass as
  . The solar metallicity star with vini = 350 km s−1 does not change its colour from the red giant star until it goes through core collapse. This fact implies that the core potential is larger than the critical value for the occurrence of the blue loop. The heated H-shell induced by the larger helium core disfavours the blue loop extension.
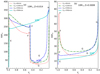 |
Fig. 3. Photospheric radius as a function of central helium mass fraction Ycenter during the core helium burning. Panel a: for the 10 M⊙ stars with Z = 0.014 but with different initial rotational velocities of vini = 0 km s−1, 120 km s−1, 250 km s−1, 350 km s−1. Panel b: for the 10 M⊙ stars with Z = 0.0008 but with the corresponding different initial rotational velocities. |
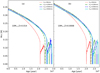 |
Fig. 4. Mass of the convective core (in the unit of the whole stellar mass) as a function of evolutionary age. Panel a: for the 10 M⊙ stars with Z = 0.014 but with different initial rotational velocities of vini = 0 km s−1, 120 km s−1, 250 km s−1, 350 km s−1. Panel b: for the 10 M⊙ stars with Z = 0.0008 but with the corresponding different initial rotational velocities. |
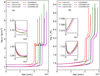 |
Fig. 5. Evolution of central temperature and central density as a function of evolutionary time. Panel a: evolution of central density as a function of evolutionary time for the 10 M⊙ stars with Z = 0.014 but with different initial rotational velocities of vini = 0 km s−1, 120 km s−1, 350 km s−1. Panel b: evolution of central temperature as a function of the evolutionary time for the 10 M⊙ stars with Z = 0.0008 but with different initial rotational velocities of vini = 0 km s−1, 120 km s−1, 350 km s−1. |
However, the rotation-induced mixing can produce rapid redwards evolution across the Hertzsprung gap. Therefore, more evolution time during the core helium burning can be maintained on the red supergiant branch. In this situation, the envelope becomes loosely bound, making it relatively easy for the large photon flux to remove mass from the stellar surface. An increment in mass loss during the red supergiant giant favours the development of blue loops in the more massive star (i.e. M ≥ 13 M⊙) because stellar winds tend to reduce the critical potential Φcrit. However, this effect plays a minor role in the formation of the blue loop for a star of 10 M⊙.
In the metallicity range of Z > 0.001, a high metallicity increases both the opacity and the convective region in the core during the main sequence, and therefore massive solar metallicity models have more massive cores than their metal-poor counterparts. A smaller core in metal-poor stars has a lower core potential, making it more likely for the blue loop to be triggered (Lamers & Levesque 2017). However, the situation deviates from this trend under the extremely poor metal condition of Z < 0.001. The smaller the metallicity, the greater the core mass. This is because of the higher radiative pressure and central temperature. The blue loop appears earlier but the blue loop extension becomes smaller for the non-rotational model with Z = 0.0008. For example, the radius drops from 74.1 R⊙ to 17.4 R⊙ during the blue loop for the non-rotational model with Z = 0.0008, whereas it falls from 215 R⊙ to 25.7 R⊙ for the counterpart Z = 0.014 (cf., Fig. 3). Low metallicity has a similar effect to rotation. This fact indicates that the quantity Lg in Eq. (10) becomes smaller for the low-metallicity star with vini = 350 km s−1 because these conditions disfavour an extension of the blue loop.
The location of the hydrogen–helium discontinuity is an important factor in determining the blue loop extension. This continuity is produced by the outer envelope convection or the intermediate convective region (cf., points F in Fig. 6). The earlier the shell approaches this discontinuity, the sooner the blue loop starts and the further it extends (Tang et al. 2014, 2016). This is mainly because the function h decreases down to its minimum value h = 1 for a step-like hydrogen profile. In general, the deeper the location of the hydrogen–helium discontinuity, the larger its amplitude and the earlier the blue loop begins.
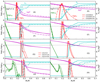 |
Fig. 6. Nuclear energy generation rates by hydrogen (red lines) and helium burning (green lines), temperature profile (purple line), and internal hydrogen profile (cyan lines) as a function of interior mass for the considered 10 M⊙ star. The horizontal black dotted line represents the temperature T = 2.0 × 10⁷ K at which hydrogen burning becomes active. Panels E, F, G, and H correspond to the evolutionary points labelled E, F, G, and H in Fig. 1, respectively. We note that the hydrogen abundance has been shifted upward in order to match the scale of the right-hand axis, that is 4XH + 5. Left panels: for the 10 M⊙ stars with Z = 0.014 but with different initial rotational velocities of vini = 0 km s−1, 120 km s−1, 350 km s−1. Right panels: for the 10 M⊙ stars with Z = 0.0008 but with different initial rotational velocities of vini = 0 km s−1, 120 km s−1, 350 km s−1. |
From Fig. 2, we notice that rapid rotation can delay or even prevent the occurrence of the blue loop. The hydrogen–helium discontinuity is located at a temperature below 2 × 10⁷ K and the hydrogen burning shell does not reach the hydrogen–helium discontinuity in the solar models with vini = 350 km s−1 (cf., point F in left panel of Fig. 6). The blue loop is not triggered in this model. Moreover, rotational mixing tends to smoothen hydrogen abundance profiles and to reduce both the amplitude and the gradient of the hydrogen–helium discontinuity.
The first dredge-up becomes shallower and this produces a shallower hydrogen–helium discontinuity of lower amplitude for the solar metallicity model with vini = 350 km s−1 (cf., point F in left panels in Fig. 6). Rotation-induced mixing results in more helium in the outer envelope. The opacity becomes lower and the corresponding intermediate or outer convective regions become less active or even absent. When this outer convective region reduces in mass extension, it can cause the star to expand on a short timescale towards becoming a red giant star for the solar metallicity model with vini = 350 km s−1.
The small step in the hydrogen profile due to the sporadic appearance of the intermediate convective region can trigger the blue loop in the non-rotational model with Z = 0.0008. The outer convective region does not appear at all in the models with Z = 0.0008. Therefore, the blue loop extension is only strongly influenced by the depth of the intermediate convective zone, which is very close to the hydrogen-burning shell. Moreover, the magnitude of the hydrogen–helium discontinuity produced by the intermediate convective region in the solar-metallicity model is too small to boost the blue loop, which is in contrast to the model with Z = 0.0008. For example, the bottom of the intermediate convective region has nearly permeated through the hydrogen-burning shell in the low-metallicity model with vini = 350 km s−1, but the blue loop does not appear at all. It is the amplitude of the hydrogen–helium discontinuity (i.e. a smaller mean molecular weight) rather than the mass contained between the hydrogen burning shell and the hydrogen–helium discontinuity that was found by Tang et al. (2014, 2016) to play a decisive role in boosting the blue loop.
Because of the combined effect of both lower CNO abundance in the hydrogen burning shell and the lower opacity in the outer envelope, the low-metallicity model with zero rotation boosts the blue loop as a blue giant star, instead of as a red giant star as in the solar-metallicity model (point F in the right panels of Fig. 1). The star shrinks and shifts towards higher effective temperature as the core helium fraction decreases. This is mainly because the helium fraction in the hydrogen shell falls significantly when the hydrogen burning shell moves outwards. When the helium abundance in the shell begins to maintain an approximately constant value, the shrinkage terminates and the star starts to shift back towards the red region of the HR diagram for the first time.
3.3.4. Other physical factors associated with the blue loop
The occurrence and extension of blue loops depends quite sensitively on a number of physical factors, such as overshooting, nuclear reaction rates, envelope structure (i.e. radiative or convective), and the virial theorem. However, these factors may have an indirect or secondary impact on the formation of the blue loop.
Convective overshooting. The extension of the blue loop heavily depends on the overshooting parameter. The smaller the core overshooting parameter and the corresponding core potential, the larger the extension of the blue loop. This is because a smaller core mass implies a lower local temperature of the hydrogen burning shell. The reduced energy rate of the H-burning shell favours the formation of the blue loop. However, the downward overshooting produced by the first dredge-up in the outer envelope helps to reveal a well-extended blue loop because the hydrogen–helium discontinuity will be located at a closer proximity to the hydrogen shell source in the top left panel of Fig. 8 (Maeder 2009; Wagle et al. 2019).
The nuclear reaction rates. The nuclear reaction rates, such as 12C(α, γ)16O and 14N(p, γ)15O, have an important impact on the blue loop extension (Iben 1966; Bertelli et al. 1985; Brunish & Becker 1990; Xu & Li 2004a,b; Weiss et al. 2005; Halabi et al. 2012). A higher nuclear rate 12C(α, γ)16O favours the extension of the blue loop in the HR diagram because it requires a slightly lower core temperature, which reduces the local temperature of hydrogen burning shells. A higher shell hydrogen burning 14N(p, γ)15O rate can cause the outer envelope to reach a larger size. This can produce a deeper outer convective envelope or intermediate convective zone. Xu & Li (2004a,b) found that a higher 14N abundance in the H-burning shell has an important impact on the formation of the blue loop; it causes the H-burning shell to move quickly towards the lower temperature region at the evolution phase previous to the blue loop and decreases both the stellar luminosity and the envelope convection mass. This higher 14N abundance also places the hydrogen discontinuity closer to the shell source, which increases the stellar luminosity during the blue loop phase by adding a greater abundance of hydrogen into the H-burning shell. However, Tang et al. (2014, 2016) found that by changing these mentioned nuclear reaction rates or the mixing length within a suitable range, these model cannot give rise to the extended blue loop in the HR diagram. These facts imply that the above factors might not be the decisive factor that triggers the blue loop.
The envelope structure. The blue loop can also be influenced by the envelope structure. Xu & Li (2004a,4b) found that if the envelope convective factor – which is defined as the envelope convection mass divided by the total envelope mass – is larger than a critical value, the star will not boost the blue loop into its subsequent evolution. Chiosi et al. (1992) have showed that that in response to an increase in nuclear luminosity at the base of the envelope, the radiation-dominated envelope shows an increase in effective temperature (or its temperature gradient) with decreasing radius. When the nuclear luminosity of the hydrogen burning shell is greater than the surface luminosity. The excess energy (i.e. the absolute value of Lg) can be absorbed by the envelope and this can cause the envelope to expand according to the virial theorem. Because convective motion is more efficient than radiation at transporting energy, the outer envelope tends to expand in response to an increase in the hydrogen shell luminosity according to Eq. (9). The convective envelope tends to reduce the excess energy due to a high energy-transportation efficiency. The star evolves upwards along the Hayashi line and does not favour the occurrence of a blue loop at all. Conversely, a star with highly receded convective envelope (i.e. a radiation-governed envelope) will evolve bluewards in response to an increase in the actual surface luminosity (i.e. Lnuc < Ls in Eq. (9)). This is because the radiation flux is approximately proportional to the quartet of the temperature (i.e. Frad ∼ T4).
The virial theorem. Some investigators have adopted the virial theorem (or the mirror effect) to explain the formation of the blue loop (Wagle et al. 2019; Hofmeister et al. 1964). Moreover, the back and forth motions through the HR diagram is a direct effect of a star complying as a whole with the virial theorem. Expansion of the helium core can cause the envelope to shrink and the star shifts from the red region to the blue region in the HR diagram. However, the detailed evolution of the stellar luminosity during the blue loop cannot be fully explained by the virial theorem. The virial theorem can merely be regarded as an effect, rather than a cause of the blue loop. The response of the envelope to an increase in actual surface luminosity Ls in Eq. (9) is the decisive cause of the blue loop.
As shown in Fig. 2, the hottest point (i.e. point G) is attained when the central helium drops to a value of about 0.3. This corresponds to a maximum shrinkage of the stellar radius and the maximum value of the luminosity of the hydrogen burning shell. After point G, the envelope starts to expand and the star reaches the red giant branch again (i.e. point H in Fig. 1) when the central helium fraction falls to a value of about 0.06. The reason is that the growth of the mass of the core increases the corresponding core potential Φc and this variation can trigger evolution towards lower effective temperature. After the core helium exhaustion, the star evolves along the Hayashi line.
3.4. Surface enrichments of chemical elements
3.4.1. The surface enrichment factor of (14N/12C)/(14N/12C)ini
Panels a and b in Fig. 7 show the variation of the surface 14N/12C abundance ratio normalised to its initial value for various initial rotation rates and two different metallicities as a function of the evolutionary age. We find no surface enrichment of 14N/12C in the non-rotational model during the main sequence. Moreover, the surface enrichment processes in the non-rotational model are assisted by the convective movement. This phase is considered as the first dredge-up that efficiently mixes the surface matter with deeper layers after the main sequence. The bottom of the convective envelope attains its deepest mass coordinate which is below the maximum extension of the previous convective core during the main sequence. Therefore, the nuclear reaction material, which has been processed by the CNO-cycle in the former convective core, can be diffused throughout the envelope and appears at the stellar surface. This process brings an excess of 13C, 14N, and 4He to the surface and also brings about 12C depletion.
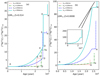 |
Fig. 7. Evolution of surface mass fraction ratio of carbon to nitrogen as a function of evolutionary ages. Left panels: for the 10 M⊙ stars with Z = 0.014 but with different initial rotational velocities, vini = 0 km s−1, 120 km s−1, 250 km s−1, and 350 km s−1. Right panels: for the 10 M⊙ stars with Z = 0.0008 but with different initial rotational velocities. |
Comparing the non-rotational model with Z = 0.014 with the model with Z = 0.0008, we find that the dredge-up develops more deeply in a high-metallicity star than that in its low-metallicity counterpart. The surface helium increases and the corresponding hydrogen decreases, but the enrichment factor of (14N/12C)/(14N/12C)ini can be increased by a large factor. For instance, the surface-enrichment factor is suddenly increased from a factor of 1.0 to about 6.0 in the non-rotational model with Z = 0.014, whereas the model with low metallicity, Z = 0.0008, does not produce the first dredge-up. These facts imply that the efficiency of the first dredge-up generally increases with metallicity. The first dredge-up results in an increase in the helium abundance at the surface and therefore the envelope has a lower opacity. This process leads to an increased luminosity compared to the model without the dredge-up. The intermediate plateau in the curve is sustained throughout the whole central helium burning because the internal convection boundary has shifted to the surface. The outer convection region disappears for some time, and then develops further down, reaching the internal boundary of the hydrogen-burning shell at the top of the helium core again. This is the second dredge-up, which occurs after the core helium burning. As a result, a further, smaller enrichment episode occurs around the carbon–oxygen core growth and the shell helium burning stages, and is sustained until the core-collapse stage. We note that the efficiency of the second dredge-up increases with decreasing metallicity. For example, the amplitude of the enrichment of (14N/12C)/(14N/12C)ini in the star with Z = 0.014 increases from a factor of 5.97 to 6.6, whereas it increases from a factor of 1.1 to 8.5 in the counterpart with Z = 0.0008. The second dredge-up become less efficient than the first one in the star with Z = 0.014.
The most important effect of rotation is the production of various instabilities, which can trigger the chemical element mixing inside the star. The nuclear production in the core is brought towards the stellar surface by rotation-induced mixing, while the chemical elements in the outer envelope are transmitted to the stellar core. The hydrogen abundance profile drops rapidly from the stellar surface for the rapidly rotating stars, whereas the helium abundance profile rises accordingly (cf., Fig. 8). We also find that the surface enrichment increases with the initial rotational rate. The higher the initial rotational velocities, the sooner the surface enrichment appears. The mixing of the chemical elements is mainly due to the action of the shear instability and these elements are brought towards the surface. At the time of t = 2.457 × 10⁷ years, the enrichment factor (14N/12C)/(14N/12C)ini attains 1.45 in the solar-metallicity model with vini = 120 km s−1, whereas it is 13.19 in the counterpart with vini = 350 km s−1. The luminosity induced by the rotation-induced mixing becomes greater and thus the radiative temperature gradient is larger. When we compare the rotating model with solar metallicity with its counterpart with low metallicity, we find that the lower the metallicity, the earlier the surface enrichment appears. For example, the enrichment factor can attain a value of 5.7 in the low-metallicity model with vini = 250 km s−1, whereas it is 1.45 in the solar-metallicity counterpart at the evolutionary age of 1.5 × 10⁷ yr. There are two main reasons for this: Firstly, the profile of the angular velocity inside the star becomes steeper and thus the corresponding shear turbulence that dominates other rotation-induced instabilities is larger at low metallicity (Maeder & Meynet 2001, 2012; Meynet & Maeder 2002). Secondly, the star becomes more compact and the characteristic time τ ∝ R2/Dshear is shorter. One can notice in both panels in Fig. 7 that rotation may change the enrichment efficiency of the dredge-up. For example, the amplitude of the enrichment factor in the non-rotational star with Z = 0.014 increases from 1.0 to 5.94, whereas it increases from 1.45 to 11.07 in the corresponding counterpart with vini = 120 km s−1 during the first dredge-up.
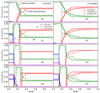 |
Fig. 8. Chemical structure of the mass fraction of hydrogen (red lines), helium (green lines), carbon (blue lines), and oxygen (purple lines) as a function of interior mass for the considered 10 M⊙ star. Panels E, F, G, and H correspond the evolutionary points labelled E, F, G, and H in Fig. 1, respectively. Left panels: for the 10 M⊙ stars with Z = 0.014 but with different initial rotational velocities, vini = 0 km s−1, 120 km s−1, and 350 km s−1. Right panels: for the 10 M⊙ stars with Z = 0.0008 but with different initial rotational velocities. |
The observations of Fransson et al. (1989) reveal evidence for CNO processing in the progenitor of SN 1987A. A nebular analysis shows a large nitrogen overabundance with N/C = 7.8 ± 4 which is a factor of 37 higher than the solar value. These latter authors suggest that this star has evolved from red to blue. This can only be reproduced by models that show a blue loop during the core helium burning (Arnett et al. 1989). The analysis of the surface abundances of the red to blue super giants may provide a further test for discriminating between the different evolutionary scenarios.
3.4.2. Effect of rotation and metallicity on Cepheids
As discussed above, the appearance of a blue loop and its extension depend on many details of the stellar models. Rotation induced by changes to the internal chemical composition inside the star plays a role. Looking at panel a in Fig. 1, we see that at Z = 0.014, rotating models still produce blue loops up to initial rotations of below about 300 km s−1. However, the blue loops are more luminous and their extensions slightly reduced compared to those seen in the non-rotating model. These are of course effects linked to the internal mixing induced by rotation. We can see in panel a of Fig. 7 that rotating models show larger surface values of (14N/12C)/(14N/12C)ini as well as helium along the blue loop. The higher helium abundance in the envelope in association with the larger helium core are the main cause for the higher luminosity. Interestingly, a very strong internal mixing suppresses the blue loop (look at the solar metallicity model with vini = 350 km s−1). It is likely that in this model the helium core has too high a gravitational potential and the star remains in the red supergiant stage until the end of its lifetime. For models with Z = 0.0008, the situation concerning the blue loops is different in the sense that no models show real blue loops (we consider a real blue loop to be a back and forth excursion in the HR diagram starting and ending from a red supergiant stage during the core He-burning phase). The Cepheids are formed during mainly the first crossing of the Hertzsprung gap (cf., panel b in Fig. 1). Instead, those models with Z = 0.0008, as discussed above, start their core He-burning phase in the blue region of the HR diagram. These models show an important increase in the luminosity, while they have an effective temperature of higher than about log Teff ∼ 3.9. This increase appears at higher effective temperature and is stronger with increasing rotation speed in the model.
The above discussion has interesting consequences for interpretation of Cepheids. Because rotation increases the luminosity of the loop in the solar metallicity model, the evolutionary mass of a rotating Cepheid would be inferior to that of a non-rotating one (Anderson et al. 2014, 2016a). For example, the luminosity of 10 M⊙ Cepheids with zero rotation is log L/L⊙ ∼ 4.2, whereas it is 4.3 for the counterpart of the same mass but with vini = 250 km s−1. If most of the Cepheids were to come from an initial rotation of around 200 km s−1, we would expect an overluminosity of about 0.1 dex. A non-rotating star would need to be more massive by about 10% to reach such a luminosity. At lower metallicities, we would have a similar effect. However, at that metallicity, most of the Cepheids would evolve redwards. We also note that since the pulsation of Cepheids is driven by the region of partial ionisation of helium, this might have some impact on the pulsation properties of the Cepheids. The pulsation amplitude is increased due to the enhanced helium in the partial ionisation zone and the corresponding pulsation period is also enhanced according to the period–luminosity relation (Cox 1980).
3.5. Chemical element profile at the core helium exhaustion
In this section, we aim to discuss how rotation and metallicity have an impact on the pre-supernova structure. When the star becomes bluer along the blue loop, the outer convective zone becomes shallower and may even disappear. As the internal structure of the star changes, this has an important impact on the pre-supernova structure.
Panels E–H in Fig. 8 show the mass fraction of hydrogen, helium, carbon, and oxygen as a function of the Lagrangian mass for the non-rotating and rotating stars during the core helium burning. From the onset of the core helium burning, the main nuclear burning is the 3α reaction, which can fuse 4He into 12C inside the convective core. At the subsequent stage, the 12C + α reaction gradually takes charge of the 3α reaction when a fraction of carbon appears in the core. Therefore, 16O can be generated in the core and the final central ratio of 16O/12C is close to 3.33, increasing somewhat with the core mass due to a higher central temperature and density.
We can clearly see in Fig. 6 that the peak of the hydrogen shell burning rate lies in a larger mass coordinate from point E to point H for rotating stars. This implies that rapid rotation can increase the mass of CO cores because the rotation-induced mixing can also continuously transfer helium from the outer envelope to the core. The higher the initial rotational rates, the greater the CO core mass. The larger size of the core indicates a higher central temperature. Furthermore, the energy generation rate from the hydrogen burning shell can be boosted by a larger core to some extent. Therefore, rotational mixing can clearly decrease the mass fraction 12C left at the point of core helium exhaustion due to the higher energy generation rate of the core helium burning. The chemical element 16O can be significantly increased in the core for the rotational model. This gives rise to a higher ratio of 16O/12C in a rotating star.
An extremely low metallicity can also amplify the carbon–oxygen core, in contrast to solar metallicity (cf., point H in the bottom left and right panels of Fig. 8). In the star with low metallicity, the central density becomes lower, whereas the corresponding central temperature tends to be higher during post-main sequence evolution (cf., Fig. 5). At the exhaustion of core hydrogen burning, the central temperature and density are log Tc[K] = 8.165 and log ρc[g cm−3] = 2.576 for the solar-metallicity model with zero rotation, whereas these are log Tc[K] = 8.173 and log ρc[g cm−3] = 3.546 for the counterpart with low metallicity. These conditions favour the destruction of carbon through alpha captures and result in a lower carbon mass fraction and a higher oxygen mass fraction in the core. This is because the nuclear reaction rate of alpha capture onto carbon depends quite sensitively on temperature. Furthermore, the luminosity contribution of the core helium burning LHe also increases with the core mass. In comparison with the solar-metallicity model with vini = 120 km s−1, more evolutionary time can be spent in the red supergiant stage because of the absence of the blue loop for the counterpart with vini = 350 km s−1. This causes a slight reduction in the mass of the central carbon-oxygen core and a lower ratio of 16O/12C, because stellar winds in rapidly rotating models are of greater magnitude. Likely, the presence or absence of a blue loop has no major impact on the pre-supernova structure.
The amount of carbon left by the core helium burning determines the final stellar compactness and the mass–radius relationship at the advanced evolutionary stage, because it is responsible for the increasing velocity of the carbon-burning shell before the final core collapse (Chieffi & Limongi 2020; Long et al. 2022). Generally, a lower fraction of carbon left by the core helium burning may indicate higher stellar compactness. A high value of stellar compactness can favour the formation of black holes, whereas a low value of stellar compactness increases the likelihood of the production of a neutron star after a supernova explosion.
4. Summary and conclusion
In this paper, we investigate how rapid rotation and low metallicity change the evolutionary characteristics of the blue loop. We consider single-star models with various initial rotational velocities and two different metallicities. Before presenting the effects of these factors on the blue loops, let us briefly recall how rotation affects the evolution of stars during their entire lifetime.
-
At solar metallicity, a rotating model is brighter than a non-rotating one during the main sequence and produces a hotter and bigger helium core. This is a result of the fact that the radiative envelope is enriched in helium by rotational mixing. This decreases the opacity and also increases the global mean molecular weight of the star. As a result, the star is more luminous. Furthermore, the convective core is larger at a given evolutionary stage because it continuously receives hydrogen, which diffuses by rotational mixing from the envelope into the core.
-
When the metallicity is decreased, rotational mixing becomes more efficient. The above effects are still stronger.
-
The first crossing of the HR gap occurs very differently depending on the metallicity (regadless of rotation). At solar metallicity, the first crossing is sufficiently rapid for the ignition of the helium in the core to occur when the star is a red supergiant. At low metallicity, the ignition of the helium in the core occurs when the star is still in a blue region of the HR diagram; bluer for faster rotation. This is related to differences in the helium distribution above the core.
-
Surface enrichment of chemical species (i.e. the mass ratio of (14N/12C)/(14N/12C)ini) increase with the initial rotational velocity but decreases with increasing metallicity. Both these enrichments of chemical elements are assisted by the external convection zone, which reaches upwards to the surface of the star. The efficiency of the first dredge-up depends quite sensitively on the metallicity and initial rotational rates.
-
The mass fraction of 12C left in the core when core helium is depleted can significantly affect the structure of the progenitor of supernovae. Generally, the mass fraction of 12C is left in the core after core helium burning decreases with increasing CO core mass. The fraction of 12C left over heavily depends on the initial rotational velocity and the metallicity. The remaining mass fraction of 12C in the core is lower in the model with a higher initial rotational velocity. This can contribute to a faster outward shift of the 12C burning shell and make the core of the star more compact.
The extension or occurrence of the blue loops is closely related to several important physical factors, such as the metallicity, the mass of the helium core, and the gradient and amplitude of the hydrogen–helium discontinuity above the core. The main conclusions can be summarised as follows:
-
The hydrogen profile has an important impact on the envelope through a hydrostatic effect. A larger amplitude and steeper gradient of the hydrogen–helium discontinuity (i.e. an environment with a lower mean molecular weight) favours the formation of a more extended blue loop. The earlier the hydrogen burning shell approaches this hydrogen–helium discontinuity, the earlier the loop begins. At solar metallicity, all our models show well-developed blue loops except for the fastest rotating one. In the fastest rotating model, the amplitude and gradient of the hydrogen–helium discontinuity become too low and shallow, respectively, to produce the blue loop. The blue loops of the rotating models are slightly less extended. Other physical factors, such as overshoot, core potential, nuclear reaction, the envelope structure and so on, are indirect or secondary drivers of the formation of the blue loop.
-
At low metallicities Z = 0.0008, there is no real blue loops. The core helium ignition occurs in the blue position of the HR diagram and the effective temperature is higher than log Teff = 3.9 during most of the core helium burning phase. At the onset of core helium ignition, the larger the initial rotational velocity, the higher the effective temperature.
-
At solar metallicities, the Cepheids originating from rotating models are enriched in helium at the surface. The surface helium abundance in mass fraction is inferior or equal to 0.338 for the models with vini ≤ 250 km s−1. Because the pulsation of Cepheids is driven by the partial ionisation of helium in the outer layers, this helium-enrichment has consequences for their pulsation properties.
-
Given that above some initial rotation the blue loops are suppressed at solar metallicity, there is an upper limit to the surface rotation of Cepheids and of their surface helium enrichment. Cepheids originating from rotating models are more luminous than those coming from non-rotating or slowly rotating progenitors. If most of the Cepheids come, from initial rotational rates of around 200 km s−1, we expect an overluminosity of about 0.1 dex. A non-rotating star would need to be more massive by about 10% to reach such a luminosity. The evolutionary masses of Cepheids can be overestimated if the effects of rotational mixing are neglected (Anderson et al. 2014, 2016b).
-
At low metallicities, Z = 0.0008, the Cepheids are mainly formed during the first crossing of the Hertzsprung gap and present stronger surface nitrogen enrichment than at solar metallicity. It is likely that the presence or absence of a blue loop has no distinct impact on the pre-supernova structure.
It would be interesting to extend this study to a larger mass range and compare the distributions of stars in the HR diagram after the main sequence phase. A comparison between the positions of Cepheids and the stars along the blue loops would also be insightful. This would provide extremely interesting constraints on the post-main sequence evolution of intermediate and massive stars up to a mass of around 12 M⊙.
The production of the intermediate convective region requires a condition whereby the radiation temperature gradient is approximately equal to the adiabatic temperature gradient (Godart et al. 2009). This zone is produced by the decrease in radiative and adiabatic temperature gradient during the previous main sequence. The transformation of hydrogen into helium decreases the core opacity as well as the radiative temperature gradient. Therefore, this leads to a receding convective core. A radiative temperature gradient is very close to the adiabatic one on the top of the convective core. When the hydrogen burning shell starts to burn in this zone at the post-main sequence phase, the radiative temperature gradient increases very quickly and becomes larger than the adiabatic gradient because of a larger L/m ratio. The radiative temperature gradient has a relationship of  and an intermediate convective region can be formed in (or near) the hydrogen burning shell (Godart et al. 2009).
The convective motion efficiently mixes the profile of chemical elements in the outer envelope and produces a near-vertical jump of the hydrogen helium profile that marks the innermost point of convective penetration. This near-vertical jump of chemical elements is defined as the hydrogen helium discontinuity (cf., the top panels of Fig. 8).
The function h = h(Δm, ΔX) describes the effect of the chemical profile on the core potential, which is defined by h = econstant ⋅ Δm ⋅ ΔX. The quantity △X is the amplitude of the change of the H-mass fraction over the smooth transition zone, while △m is the width in mass of the transition zone (Kippenhahn et al. 2013; Lauterborn et al. 1971). The value of the function h increases with the amount of helium excess in the transition region above the core. A larger value of h indicates a greater mass pocket between the H-burning shell and the H−He discontinuity left by the first dredge-up episode and disfavours extension of the blue loop.
Acknowledgments
This work was sponsored by the National Natural Science Foundation of China (Grant Nos. 11863003, 12173010), Swiss National Science Foundation (project number 200020-172505), Science and technology plan projects of Guizhou province (Grant No. [2018]5781). Dr. Y. Qin gratefully acknowledges the Science Foundation of University in Anhui Province (Grant No. KJ2021A0106). We are very grateful to an anonymous referee for his/her valuable suggestion and very insightful remarks, which have improved this paper greatly.
References
- Alongi, M., Bertelli, G., Bressan, A., & Chiosi, C. 1991, A&A, 244, 95 [NASA ADS] [Google Scholar]
- Anderson, R. I., Ekström, S., Georgy, C., et al. 2014, A&A, 564, A100 [NASA ADS] [CrossRef] [EDP Sciences] [Google Scholar]
- Anderson, R. I., Mérand, A., Kervella, P., et al. 2016a, MNRAS, 455, 4231 [Google Scholar]
- Anderson, R. I., Saio, H., Ekström, S., Georgy, C., & Meynet, G. 2016b, A&A, 591, A8 [NASA ADS] [CrossRef] [EDP Sciences] [Google Scholar]
- Arnett, W. D., Bahcall, J. N., Kirshner, R. P., & Woosley, S. E. 1989, ARA&A, 27, 629 [NASA ADS] [CrossRef] [Google Scholar]
- Bertelli, G., Bressan, A. G., & Chiosi, C. 1985, A&A, 150, 33 [NASA ADS] [Google Scholar]
- Bono, G., Castellani, V., & Marconi, M. 2000, ApJ, 529, 293 [Google Scholar]
- Brunish, W. M., & Becker, S. A. 1990, ApJ, 351, 258 [NASA ADS] [CrossRef] [Google Scholar]
- Chaboyer, B., & Zahn, J. P. 1992, A&A, 253, 173 [NASA ADS] [Google Scholar]
- Chieffi, A., & Limongi, M. 2020, ApJ, 890, 43 [NASA ADS] [CrossRef] [Google Scholar]
- Chiosi, C., Bertelli, G., & Bressan, A. 1992, ARA&A, 30, 235 [NASA ADS] [CrossRef] [Google Scholar]
- Cox, A. N. 1980, ARA&A, 18, 15 [NASA ADS] [CrossRef] [Google Scholar]
- de Jager, C., Nieuwenhuijzen, H., & van der Hucht, K. A. 1988, A&AS, 72, 259 [NASA ADS] [Google Scholar]
- Endal, A. S., & Sofia, S. 1978, ApJ, 220, 279 [NASA ADS] [CrossRef] [Google Scholar]
- Farrell, E., Groh, J. H., Meynet, G., & Eldridge, J. J. 2022, MNRAS, 512, 4116 [NASA ADS] [CrossRef] [Google Scholar]
- Fransson, C., Cassatella, A., Gilmozzi, R., et al. 1989, ApJ, 336, 429 [NASA ADS] [CrossRef] [Google Scholar]
- Fricke, K. J., & Strittmatter, P. A. 1972, MNRAS, 156, 129 [NASA ADS] [CrossRef] [Google Scholar]
- Godart, M., Noels, A., Dupret, M. A., & Lebreton, Y. 2009, MNRAS, 396, 1833 [NASA ADS] [CrossRef] [Google Scholar]
- Godart, M., Noels, A., & Scuflaire, R. 2013, Eur. Phys. J. Web Conf., 43, 01008 [CrossRef] [EDP Sciences] [Google Scholar]
- Halabi, G. M., El Eid, M. F., & Champagne, A. 2012, ApJ, 761, 10 [NASA ADS] [CrossRef] [Google Scholar]
- Heger, A., & Langer, N. 2000, ApJ, 544, 1016 [CrossRef] [Google Scholar]
- Hofmeister, E., Kippenhahn, R., & Weigert, A. 1964, ZAp, 60, 57 [NASA ADS] [Google Scholar]
- Huang, W., Gies, D. R., & McSwain, M. V. 2010, ApJ, 722, 605 [Google Scholar]
- Iben, I., Jr. 1966, ApJ, 143, 483 [NASA ADS] [CrossRef] [Google Scholar]
- Kippenhahn, R., & Weigert, A. 1990, Stellar Structure and Evolution (Berlin, Heidelberg: Springer) [Google Scholar]
- Kippenhahn, R., Weigert, A., & Weiss, A. 2013, Stellar Structure and Evolution (Berlin, Heidelberg: Springer) [Google Scholar]
- Lamers, H. J. G. L. M., & Levesque, E. M. 2017, Understanding Stellar Evolution (Bristol, UK: IOP Publishing) [Google Scholar]
- Langer, N. 2012, ARA&A, 50, 107 [CrossRef] [Google Scholar]
- Lauterborn, D., Refsdal, S., & Weigert, A. 1971, A&A, 10, 97 [NASA ADS] [Google Scholar]
- Long, G., Song, H., Meynet, G., et al. 2022, ApJS, 262, 26 [NASA ADS] [CrossRef] [Google Scholar]
- Maeder, A. 1997, A&A, 321, 134 [NASA ADS] [Google Scholar]
- Maeder, A. 2009, Physics, Formation and Evolution of Rotating Stars (Berlin, Heidelberg: Springer) [Google Scholar]
- Maeder, A., & Zahn, J.-P. 1998, A&A, 334, 1000 [NASA ADS] [Google Scholar]
- Maeder, A., & Meynet, G. 2000, ARA&A, 38, 143 [Google Scholar]
- Maeder, A., & Meynet, G. 2001, A&A, 373, 555 [NASA ADS] [CrossRef] [EDP Sciences] [Google Scholar]
- Maeder, A., & Meynet, G. 2012, Rev. Mod. Phys., 84, 25 [Google Scholar]
- Meynet, G., & Maeder, A. 2002, A&A, 390, 561 [NASA ADS] [CrossRef] [EDP Sciences] [Google Scholar]
- Meynet, G., Georgy, C., Hirschi, R., et al. 2011, Bull. Soc. R. Sci. Liege, 80, 266 [NASA ADS] [Google Scholar]
- Meynet, G., Kudritzki, R.-P., & Georgy, C. 2015, A&A, 581, A36 [NASA ADS] [CrossRef] [EDP Sciences] [Google Scholar]
- Pinsonneault, M. H., Kawaler, S. D., Sofia, S., & Demarque, P. 1989, ApJ, 338, 424 [Google Scholar]
- Reimers, D. 1975, Problems in Stellar Atmospheres and Envelopes (New York: Springer-Verlag), 229 [CrossRef] [Google Scholar]
- Reimers, D. 1977, A&A, 61, 217 [NASA ADS] [Google Scholar]
- Robertson, J. W. 1972, ApJ, 173, 631 [NASA ADS] [CrossRef] [Google Scholar]
- Schootemeijer, A., & Langer, N. 2018, A&A, 611, A75 [NASA ADS] [CrossRef] [EDP Sciences] [Google Scholar]
- Schootemeijer, A., Langer, N., Grin, N. J., & Wang, C. 2019, A&A, 625, A132 [NASA ADS] [CrossRef] [EDP Sciences] [Google Scholar]
- Song, H. F., Maeder, A., Meynet, G., et al. 2013, A&A, 556, A100 [NASA ADS] [CrossRef] [EDP Sciences] [Google Scholar]
- Song, H. F., Meynet, G., Maeder, A., Ekström, S., & Eggenberger, P. 2016, A&A, 585, A120 [NASA ADS] [CrossRef] [EDP Sciences] [Google Scholar]
- Stothers, R., & Chin, C.-W. 1973, ApJ, 179, 555 [NASA ADS] [CrossRef] [Google Scholar]
- Stothers, R. B., & Chin, C.-W. 1991, ApJ, 374, 288 [NASA ADS] [CrossRef] [Google Scholar]
- Talon, S., & Zahn, J. P. 1997, A&A, 317, 749 [NASA ADS] [Google Scholar]
- Tammann, G. A., Sandage, A., & Reindl, B. 2003, A&A, 404, 423 [NASA ADS] [CrossRef] [EDP Sciences] [Google Scholar]
- Tang, J., Bressan, A., Rosenfield, P., et al. 2014, MNRAS, 445, 4287 [NASA ADS] [CrossRef] [Google Scholar]
- Tang, J., Bressan, A., Slemer, A., et al. 2016, MNRAS, 455, 3393 [NASA ADS] [CrossRef] [Google Scholar]
- Turner, D. G., & Burke, J. F. 2002, AJ, 124, 2931 [NASA ADS] [CrossRef] [Google Scholar]
- Wagle, G. A., Ray, A., Dev, A., & Raghu, A. 2019, ApJ, 886, 27 [NASA ADS] [CrossRef] [Google Scholar]
- Wagle, G. A., Ray, A., & Raghu, A. 2020, ApJ, 894, 118 [NASA ADS] [CrossRef] [Google Scholar]
- Walmswell, J. J., Tout, C. A., & Eldridge, J. J. 2015, MNRAS, 447, 2951 [NASA ADS] [CrossRef] [Google Scholar]
- Weiss, A., Serenelli, A., Kitsikis, A., Schlattl, H., & Christensen-Dalsgaard, J. 2005, A&A, 441, 1129 [NASA ADS] [CrossRef] [EDP Sciences] [Google Scholar]
- Xu, H. Y., & Li, Y. 2004a, A&A, 418, 213 [NASA ADS] [CrossRef] [EDP Sciences] [Google Scholar]
- Xu, H. Y., & Li, Y. 2004b, A&A, 418, 225 [NASA ADS] [CrossRef] [EDP Sciences] [Google Scholar]
- Zahn, J. P. 1992, A&A, 265, 115 [NASA ADS] [Google Scholar]
All Figures
|
Fig. 1. Evolutionary tracks of the stars on the HR diagram. Panel a: for the 10 M⊙ stars with Z = 0.014 but with different initial rotational velocities, vini = 0 km s−1, 120 km s−1, 250 km s−1, 350 km s−1. Panel b: for the 10 M⊙ stars with Z = 0.0008 but with the corresponding different initial rotational velocities. The instability strip and observational data are from Bono et al. (2000), Turner & Burke (2002), Tammann et al. (2003). Point A in both panels corresponds to the position of the ZAMS and point B corresponds to the start of the overall contraction phase near the end of the main sequence (i.e. the central hydrogen mass fraction Xc ≈ 0.03). Point C corresponds to the exhaustion of hydrogen in the centre and the disappearance of the convective core and point D in the left panel implies the bottom of the Hayashi line. Point E indicates the ignition of the core helium and point F denotes the starting point of the blue loop. Point G implies the bluest location of the blue loop and point H illustrates the terminal of the blue loop. |
| In the text | |
|
Fig. 2. Effective temperature Teff as a function of central helium mass fraction Ycenter during the core helium burning. Panel a: for the 10 M⊙ stars with Z = 0.014 but with different initial rotational velocities, vini = 0 km s−1, 120 km s−1, 250 km s−1, 350 km s−1. Panel b: for the 10 M⊙ stars with Z = 0.0008 but with with the corresponding different initial rotational velocities. |
| In the text | |
|
Fig. 3. Photospheric radius as a function of central helium mass fraction Ycenter during the core helium burning. Panel a: for the 10 M⊙ stars with Z = 0.014 but with different initial rotational velocities of vini = 0 km s−1, 120 km s−1, 250 km s−1, 350 km s−1. Panel b: for the 10 M⊙ stars with Z = 0.0008 but with the corresponding different initial rotational velocities. |
| In the text | |
|
Fig. 4. Mass of the convective core (in the unit of the whole stellar mass) as a function of evolutionary age. Panel a: for the 10 M⊙ stars with Z = 0.014 but with different initial rotational velocities of vini = 0 km s−1, 120 km s−1, 250 km s−1, 350 km s−1. Panel b: for the 10 M⊙ stars with Z = 0.0008 but with the corresponding different initial rotational velocities. |
| In the text | |
|
Fig. 5. Evolution of central temperature and central density as a function of evolutionary time. Panel a: evolution of central density as a function of evolutionary time for the 10 M⊙ stars with Z = 0.014 but with different initial rotational velocities of vini = 0 km s−1, 120 km s−1, 350 km s−1. Panel b: evolution of central temperature as a function of the evolutionary time for the 10 M⊙ stars with Z = 0.0008 but with different initial rotational velocities of vini = 0 km s−1, 120 km s−1, 350 km s−1. |
| In the text | |
|
Fig. 6. Nuclear energy generation rates by hydrogen (red lines) and helium burning (green lines), temperature profile (purple line), and internal hydrogen profile (cyan lines) as a function of interior mass for the considered 10 M⊙ star. The horizontal black dotted line represents the temperature T = 2.0 × 10⁷ K at which hydrogen burning becomes active. Panels E, F, G, and H correspond to the evolutionary points labelled E, F, G, and H in Fig. 1, respectively. We note that the hydrogen abundance has been shifted upward in order to match the scale of the right-hand axis, that is 4XH + 5. Left panels: for the 10 M⊙ stars with Z = 0.014 but with different initial rotational velocities of vini = 0 km s−1, 120 km s−1, 350 km s−1. Right panels: for the 10 M⊙ stars with Z = 0.0008 but with different initial rotational velocities of vini = 0 km s−1, 120 km s−1, 350 km s−1. |
| In the text | |
|
Fig. 7. Evolution of surface mass fraction ratio of carbon to nitrogen as a function of evolutionary ages. Left panels: for the 10 M⊙ stars with Z = 0.014 but with different initial rotational velocities, vini = 0 km s−1, 120 km s−1, 250 km s−1, and 350 km s−1. Right panels: for the 10 M⊙ stars with Z = 0.0008 but with different initial rotational velocities. |
| In the text | |
|
Fig. 8. Chemical structure of the mass fraction of hydrogen (red lines), helium (green lines), carbon (blue lines), and oxygen (purple lines) as a function of interior mass for the considered 10 M⊙ star. Panels E, F, G, and H correspond the evolutionary points labelled E, F, G, and H in Fig. 1, respectively. Left panels: for the 10 M⊙ stars with Z = 0.014 but with different initial rotational velocities, vini = 0 km s−1, 120 km s−1, and 350 km s−1. Right panels: for the 10 M⊙ stars with Z = 0.0008 but with different initial rotational velocities. |
| In the text | |
Current usage metrics show cumulative count of Article Views (full-text article views including HTML views, PDF and ePub downloads, according to the available data) and Abstracts Views on Vision4Press platform.
Data correspond to usage on the plateform after 2015. The current usage metrics is available 48-96 hours after online publication and is updated daily on week days.
Initial download of the metrics may take a while.