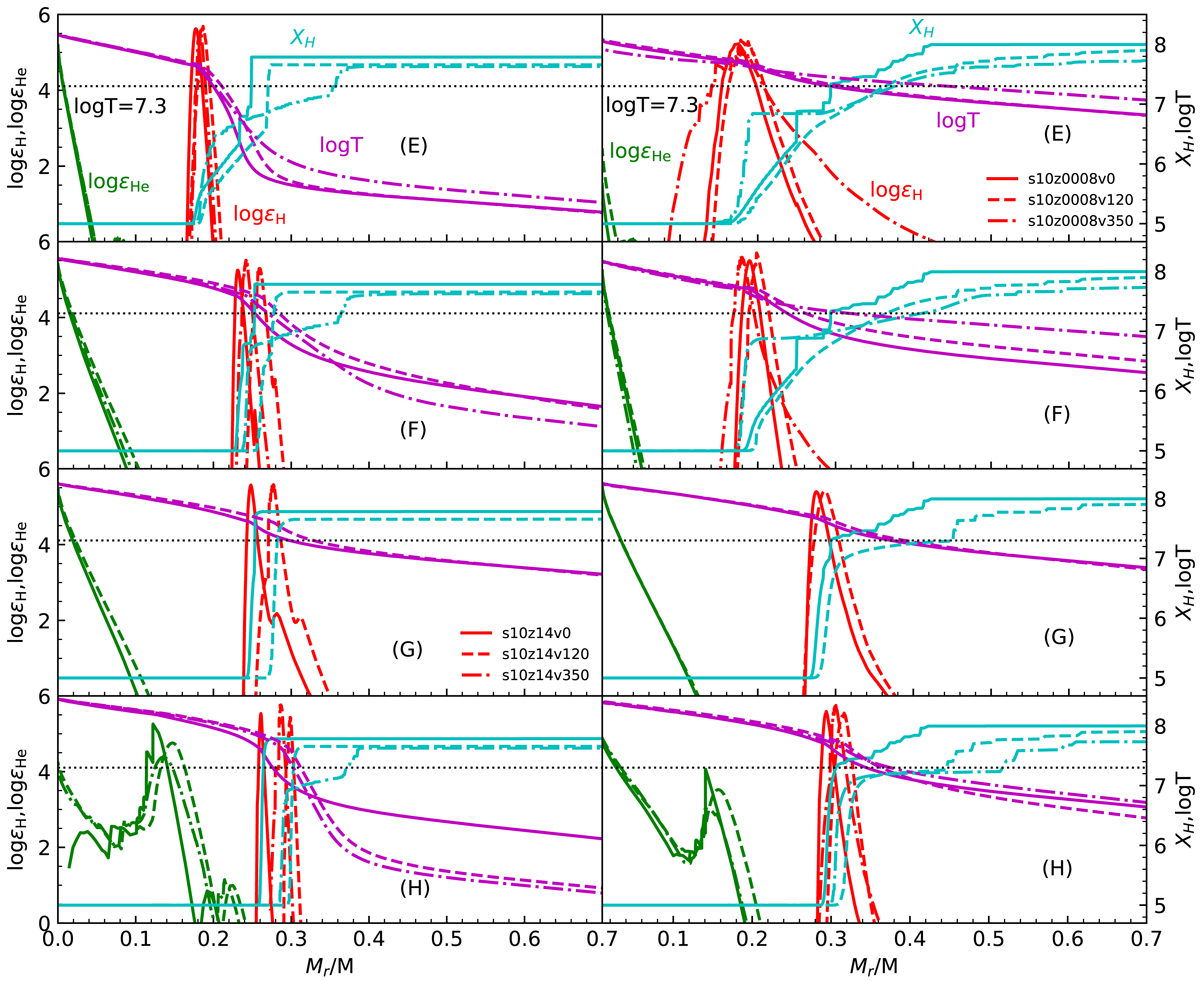
Fig. 6.
Download original image
Nuclear energy generation rates by hydrogen (red lines) and helium burning (green lines), temperature profile (purple line), and internal hydrogen profile (cyan lines) as a function of interior mass for the considered 10 M⊙ star. The horizontal black dotted line represents the temperature T = 2.0 × 10⁷ K at which hydrogen burning becomes active. Panels E, F, G, and H correspond to the evolutionary points labelled E, F, G, and H in Fig. 1, respectively. We note that the hydrogen abundance has been shifted upward in order to match the scale of the right-hand axis, that is 4XH + 5. Left panels: for the 10 M⊙ stars with Z = 0.014 but with different initial rotational velocities of vini = 0 km s−1, 120 km s−1, 350 km s−1. Right panels: for the 10 M⊙ stars with Z = 0.0008 but with different initial rotational velocities of vini = 0 km s−1, 120 km s−1, 350 km s−1.
Current usage metrics show cumulative count of Article Views (full-text article views including HTML views, PDF and ePub downloads, according to the available data) and Abstracts Views on Vision4Press platform.
Data correspond to usage on the plateform after 2015. The current usage metrics is available 48-96 hours after online publication and is updated daily on week days.
Initial download of the metrics may take a while.