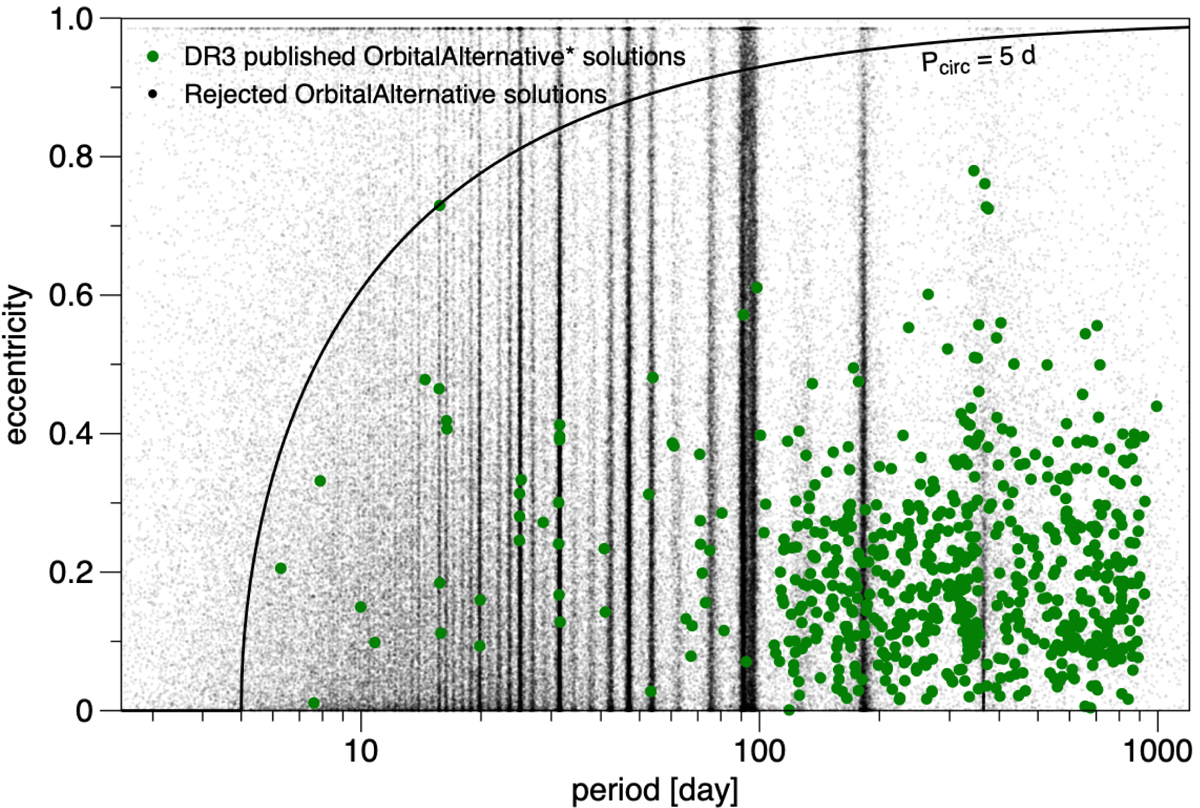
Fig. 18.
Download original image
Period-eccentricity diagram for a random sample of sources (black points) with orbits obtained by the DE-MCMC or GA algorithms from the processing the stochastic solution sample. The clear structure of period aliases is a symptom of incorrectly derived orbits and is further discussed in Holl et al. (2023). The filled green dots correspond to P and e values from ‘OrbitalAlternative’ solutions. The solid black curve indicates the maximum eccentricity attainable for an orbit that is not affected by tides, assuming a cut-off period of 5 days (see e.g., Halbwachs et al. 2005).
Current usage metrics show cumulative count of Article Views (full-text article views including HTML views, PDF and ePub downloads, according to the available data) and Abstracts Views on Vision4Press platform.
Data correspond to usage on the plateform after 2015. The current usage metrics is available 48-96 hours after online publication and is updated daily on week days.
Initial download of the metrics may take a while.