| Issue |
A&A
Volume 668, December 2022
|
|
|---|---|---|
| Article Number | A89 | |
| Number of page(s) | 8 | |
| Section | Stellar structure and evolution | |
| DOI | https://doi.org/10.1051/0004-6361/202244638 | |
| Published online | 08 December 2022 | |
Volume-limited sample of low-mass red giant stars, the progenitors of hot subdwarf stars
l. Sample selection and binary classification method⋆
1
Instituto de Física y Astronomía, Universidad de Valparaíso, Gran Bretaña 1111, Playa Ancha, Valparaíso 2360102, Chile
2
European Southern Observatory, Alonso de Cordova 3107 Santiago, Chile
3
Astronomical Institute of the Czech Academy of Sciences, 25165 Ondřejov, Czech Republic
e-mail: murat.uzundag@postgrado.uv.cl
4
Technion – Israel Institute of Technology, Physics Department, Haifa, 32000, Israel
Received:
28
July
2022
Accepted:
7
October
2022
Context. Current theory predicts that hot subdwarf binaries are produced from evolved low-mass binaries that have undergone mass transfer and drastic mass loss during either a common-envelope phase or a stable Roche-lobe overflow while on the red giant branch (RGB).
Aims. We perform a spectroscopic survey to find binary systems that include low-mass red giants near the tip of the RGB, which are predicted to be the direct progenitors of subdwarf B (sdB) stars. We aim to obtain a homogeneous sample to search for the observational evidence of correlations between the key parameters governing the formation of sdB stars and constrain the physics of stable mass transfer.
Methods. Based on data from the Gaia mission and several ground-based, multiband photometry surveys, we compiled a sample of low-mass red giant branch (RGB) candidates. The candidates were selected according to their Gaia data release 2 (DR2) color, absolute magnitude, and proper motion cuts. In this work, we concentrated on the southern hemisphere targets and conducted a spectroscopic survey of 88 red giant stars to search for the long-period RGB plus main-sequence binary systems within 200 pc. Combining radial velocity (RV) measurements from ground-based observations with CORALIE and RV measurements from Gaia DR2 and from the early data release 3 (eDR3) as well as the astrometric excess noise and renormalized unit weight error measurements from Gaia DR3, we defined a robust binary classification method. In addition, we searched for known binary systems in the literature and in Gaia DR3.
Results. We select a total of 211 RGB candidates in the southern hemisphere within 200 pc based on the Gaia DR2 color-magnitude diagram. Among them, a total of 33 red giants were reported as binary systems with orbital periods between 100 and 900 days, some of which are expected to be the direct progenitors of wide binary sdB stars. In addition, we classified 37 new main-sequence plus RGB binary candidates, whose orbital parameters will be measured with future spectroscopic follow-up.
Conclusions. Using high-quality astrometric measurements provided by the Gaia mission coupled with high-resolution spectroscopy from the ground, we provide a powerful method for searching for low-mass red giant stars in long-period binary systems.
Key words: stars: low-mass / subdwarfs / stars: late-type / binaries: spectroscopic / catalogs
© The Authors 2022
 Open Access article, published by EDP Sciences, under the terms of the Creative Commons Attribution License (https://creativecommons.org/licenses/by/4.0), which permits unrestricted use, distribution, and reproduction in any medium, provided the original work is properly cited.
This article is published in open access under the Subscribe-to-Open model. Subscribe to A&A to support open access publication.
1. Introduction
Hot subdwarf B stars (sdBs) are evolved low-mass red giants from which almost all of their envelope was stripped near the tip of the first red giant branch (RGB), according to standard evolutionary scenarios (Dorman & Rood 1993). They are evolved, compact (log g = 4.5–6.5 dex), and hot (Teff = 20 000–40 000 K) objects with radii between 0.15 R⊙ and 0.35 R⊙, located on the so-called extreme horizontal branch (EHB; see Heber 2016, for a review). Their characteristic mass is close to the core-He-flash mass (∼0.47 M⊙), and they have a very thin hydrogen envelope (MH < 0.01 M⊙). It was found that a large portion of sdBs (40–70%) are in binaries (e.g., Maxted et al. 2001; Napiwotzki et al. 2004; Copperwheat et al. 2011), implying that binary interactions are the most likely explanation for their formation.
The three binary formation channels that contribute to the sdB population are the common-envelope (CE) ejection channel (Paczynski 1976; Han et al. 2002), the stable Roche-lobe overflow (RLOF) channel (Han et al. 2002, 2003), and a binary white dwarf (WD) merger (Webbink 1984). The sdB component in the two binary scenarios (CE and RLOF) has a relatively narrow mass range, peaking at 0.47 M⊙, whereas the double helium WD merger channel creates a single subdwarf star with a relatively wide and flat distribution, from 0.42 up to 0.72 M⊙ (Han et al. 2003). Han et al. (2002) showed that the CE ejection channel leads to close binaries with WD or main sequence (MS) companions with short orbital periods ranging from hours to tens of days. Much of the observational research has focused on these short-period systems, and currently, more than 300 short-period sdB systems have been detected (and references therein Kupfer et al. 2015; Schaffenroth et al. 2019; Dai et al. 2022).
The RLOF channel generates sdB+MS binaries with orbital periods ranging from 400 up to 1600 days based on the binary population synthesis models (see the dashed red line in Fig. 3 of Vos et al. 2019). These systems are challenging to detect because thier orbital periods are long. Long-term observational campaigns have been dedicated to discovering these systems over the past decades. Recently, the orbital parameters of long-period sdB binaries have been found for 26 systems (Vos et al. 2019; Otani et al. 2022; Németh et al. 2021; Molina et al. 2022), with periods ranging from 400 to 1600 days. Because both stars are visible in the spectrum, these systems are referred to as “composite” binaries; they account for 30–40% of all sdBs (Vos et al. 2019). The observed composite binary systems present correlations between orbital elements that revealed an invaluable source of information for testing the RLOF channel. One of the first correlations that were found is the correlation between eccentricity and period, in which the eccentricity increases with increasing orbital period (Vos et al. 2015). This finding contradicts evolutionary models because all current models predict circular orbits. Vos et al. (2015) demonstrated that the observed eccentricities of wide sdB binaries may be explained by combining two eccentricity pumping mechanisms: phase-dependent RLOF, and a circumbinary disk. These models, on the other hand, fail to replicate the observed trend of greater eccentricity with longer orbital periods. Furthermore, the wide sdB binaries show another correlation between the mass ratio (q) and the orbital period (Porb) (Vos et al. 2019). The chemical history of our Galaxy can precisely explain the observed relation between the mass ratio and the orbital period in long-period sdB binaries as found by Vos et al. (2020). The authors performed a small but statistically significant binary population synthesis study with the binary stellar evolution code MESA, considering binaries with primary masses between 0.7 M⊙ and 2.0 M⊙ and initial periods between ∼100 and ∼900 days. The authors reported three important correlations between the properties of the sdB + MS binaries and their progenitors. The RG mass is inversely correlated with the mass ratio of the sdB + MS system, the RG + MS orbital period is correlated with the sdB + MS mass ratio, and last, the metallicity is correlated with the MS mass in the sdB + MS systems. They also provided ranges on the orbital periods and mass ratios of RG + MS systems that can form wide sdB binaries. By studying the properties of the RG + MS binaries, we can verify whether the population of RG + MS binaries matches the requirements needed to produce the observed number of wide sdB binaries. Furthermore, because several properties are directly linked between the progenitors and the final sdB binaries, we can directly predict the expected observed population based on the distribution of these parameters in the RG + MS binaries. This will allow a strict test of the proposed formation channel.
The aim of this study is to analyze the observed characteristics of a statistically significant volume-limited sample of low-mass evolved RGB binaries that are potential progenitors of the wide sdB binaries. We perform a spectroscopic survey searching for binarity among selected low-mass RGB candidates. In the future, obtained orbital solutions of RGB+MS binaries initiated by this work will be quite useful for a comparison of the population of progenitors with the population of the long-period sdB binaries. The observed volume-limited sample composed of pre- and post-mass transfer binaries will provide additional information about the details of mass transfer in these systems, as well as about the nature of the period-eccentricity relation observed in long-period systems.
The paper is organized as follows. In Sect. 2 we provide the sample selection from Gaia DR2 and the literature. In Sect. 3 we describe the EULER/CORALIE observations and data reduction. In Sect. 4 we describe our classification method to search for low-mass red giants in long-period binary systems. Finally, in Sect. 5, we summarize our results and give an outlook for the future.
2. Target selection
To select the low-mass red giant candidates, we used the Gaia mission data release 2 catalog (DR2; Gaia Collaboration 2018) in combination with synthetic colors for RG stars obtained from the MESA Isochrones and Stellar Tracks (MIST; Choi et al. 2016). First, we applied the criteria on photometric and astrometric quality as described in Lindegren et al. (2018, Appendix C). Then, we chose objects in the region defined by the four functions below:


where Gabs is an absolute Gaia G magnitude. Because phot_g_mean_mag of Gaia is the apparent magnitude, Gabs = phot_g_mean_mag + 5 log10(parallax/1000) + 5. These cuts focus on the systems prior to the tip of the RGB, and cut off evolved higher-mass systems. Equations (1) and (4) provided the cuts to exclude the contaminants from the subgiant and horizontal branch stars, while Eqs. (2) and (3) provided the cuts to remove the contaminants from the red clump stars. The selected region is shown in Fig. 1 (left panel) as a red shaded region, which includes a total of 6158 targets. We performed an external cross-match with several catalogs using TOPCAT (Taylor 2005). The literature was searched through the SIMBAD Astronomical Database1 (Wenger et al. 2000), and we removed 158 outlier objects that were found to be various types of systems from long-period variables (LP) to neutron stars (N*). The remaining 6000 targets were then cross-matched with the other large-area surveys using an aperture of 5 arcsec in order to clean the sample further. We cross-matched the data with the GALEX DR5 All-sky Imaging Survey (AIS; Bianchi et al. 2011) and found 3331 objects with near-ultraviolet (NUV) and far-UV (FUV) measurements. In order to obtain the near-IR measurements, we cross-matched these objects with the Wide-field Infrared Survey Explorer (WISE; Wright et al. 2010) and found 3325 targets with their W1 and W2 band measurements. Likewise, the other IR surveys, including the Infrared Astronomical Satellite (IRAS; Neugebauer et al. 1984) and the Infrared Astronomical Mission (AKARI; Murakami et al. 2007), were cross-matched to exclude the targets further when they showed any excess. The UV excess indicates WD companions, while the IR excess indicates the presence of disks or dust. These types of systems (548 stars) were excluded from the survey because we searched for RG + MS stars that have not yet undergone any type of binary interaction. Finally, we selected 2777 low-mass RG candidates within 500 pc covering the southern and northern hemispheres. The error on the parallax of all selected objects is lower than 10%.
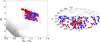 |
Fig. 1. Left: color-magnitude diagram of all low-mass (0.7 − 2.3 M⊙) RG candidates within 200 pc (blue dots) from Gaia DR2 for the southern hemisphere stars. As a comparison, the Gaia DR2 color-magnitude diagram of the 100 pc clean sample (sample C in Lindegren et al. 2018) is shown in gray. The slightly larger gray dots within the selected sample represent the low-mass RG candidates within 500 pc. The red circles show the low-mass RG candidates that were observed with EULER/CORALIE. Right: sky locations (Galactic coordinates, Aitoff projection) of the volume-limited low-mass RG sample within 200 pc with respect to the galactic coordinate system use the same color-coding. |
We limited ourselves to the southern hemisphere (δ ≤ 20°) and to the smaller volume of 200 pc to obtain a feasible number of systems for a pilot study. Within 200 pc, a total of 211 low-mass RG candidates lie in the southern hemisphere. In Fig. 1 we present the color–magnitude diagram of the selected low-mass RG candidates within 200 pc with blue dots (left panel) and their spatial distribution with respect to the galactic coordinate system (right panel).
2.1. Spectroscopic binaries from the literature
We searched for known low-mass RGs from the literature applying similar selection criteria as described in Sect. 2. A total of 300 binaries are identified by different spectroscopic surveys (e.g., Setiawan et al. 2004; Jones et al. 2011; Massarotti et al. 2008; Wittenmyer et al. 2011). We identified 24 RG binary systems with orbital periods ranging from 100 to 900 days, which might be progenitors of wide sdB + MS composite systems produced by the RLOF mechanism. The orbital elements of these systems are listed in Table 1, including the orbital period of the binary system (P), the amplitude of the RV curve (K), the eccentricity of the orbit (e), the angle of periastron (ω), the time of periastron (T0), and the mass function (f(m)).
Orbital solutions for all known binaries.
2.2. Binaries from DR3
We made use of the non-single stars catalog (I/3572) from Gaia DR3 (Gaia Collaboration 2022) to detect more binary stars within 200 pc. To select all RG candidates in binary systems, we used the same selection criteria as in Sect. 2. The DR3 catalog includes astrometric, spectroscopic, and eclipsing binaries (where solutions from the combinations of astrometry and radial velocities, or eclipsing binary light curves and radial velocities are also provided; Gaia Collaboration 2022). In the Gaia DR3 catalog, we found nine binary systems with orbital periods between 100 and 900 days. All these systems and their orbital elements are presented in Table 2.
Binary systems that are found in DR3.
3. Observations and data reduction
3.1. Observations and data reduction using CORALIE
The spectroscopic observations of the low-mass RGB candidates analyzed in this paper were obtained with the CORALIE echelle spectrograph (Queloz et al. 2001) mounted at the Swiss 1.2-m Leonhard Euler Telescope at La Silla Observatory in Chile. CORALIE has a resolving power of R ∼ 60 000, allowing for a long-term radial velocity precision up to 0.03 km s−1 (Queloz et al. 2001). CORALIE is fed by two fibers: a 2″ diameter on-sky science fiber encompassing the star, and another that can either be connected to a Fabry-Pérot etalon for simultaneous wavelength calibration (used in the case of our survey) or on-sky for background subtraction of the sky flux.
From the 200 pc RG sample, we observed 82 stars with Euler/CORALIE. The observations were made in three different runs. The details of these observations are given in Table 3, including the instrument, date, spectral range, and the signal-to-noise ratio (S/N). The observed stars have a photometric G mean magnitude ranging from 5 to 9 with a median of 7.5. The observed sample is depicted in Fig. 1 (red dots). In total, we obtained 123 high-resolution CORALIE spectra for 82 stars. We reduced and analyzed the data using the customized CERES pipeline (Brahm et al. 2017), which performs all the extraction processes from basic bias and dark and flat-field corrections (including scattered light) to order tracing, wavelength calibration, and computation of precise radial velocities using the cross-correlation technique. For 38 objects, we obtained two epochs of spectra and measured their RV shifts. The RV measurements from multi-epoch CORALIE observations are listed in the tables in Appendix A. The difference between these two different epochs is defined as ΔCRV and is provided in Table 4.
Observing log of the spectroscopic data obtained for the low-mass red giant stars.
Binary classification of low-mass red giant stars reported in this paper with two CORALIE epoch spectra.
3.2. ESO archival data
We used the ESO archive3 to search for high-resolution spectra of stars in our sample. We found a total of 8 stars observed with HARPS and 19 targets observed with FEROS. However, most of them (18 stars) were observed by the EXPRESS RV program (Jones et al. 2011; Soto et al. 2021), whose spectroscopic binaries were presented in Bluhm et al. (2016) and are listed in Table 1. One star is in a WD+AFGK binary system (Ren et al. 2020), and 2 objects are found to be single planet-host stars (Yılmaz et al. 2017; Wittenmyer et al. 2020), which were discarded from our analysis. Finally, our analysis includes 6 stars observed with FEROS. The CERES pipeline was used to reduce the FEROS spectra as it was for CORALIE data.
4. Classification method
4.1. Astrometric excess noise
The high astrometric precision currently made possible by missions such as Gaia provides several important parameters. One of the most important parameters for this work is the Gaia DR2 astrometric excess noise (AEN), which is a measure of the residuals in the five-parameter astrometric solution for the source. It can be used in astrometric binary system classification because a higher AEN value might indicate the presence of unresolved companions. Gandhi et al. (2022) reviewed the details and feasibility of this method, as well as an effective way to use AEN to search for X-ray binaries.
For our study, we made use of AEN to search for low mass RG binary candidates in our sample. Starting with the 33 known RG binaries (from the literature and DR3), we analyzed their AEN measurements. Out of 33 known binaries, 31 have AEN ≥ 0.4 mas (see Fig. 2 filled circles). Because more than 90% of the known binaries have AEN ≥ 0.4 mas, we chose this AEN value as a threshold to consider a star a potential binary candidate. In other words, these targets will be further followed up in order to confirm the binarity and finally obtain orbital periods.
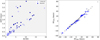 |
Fig. 2. Left: AEN vs. RUWE, including known binaries from the literature and DR3 (filled blue circles) and observed stars (open blue circles). AEN of 0.4 mas is represented by the horizontal dashed black line, and RUWE of 1.4 is represented by the vertical dashed black line. The gray shaded area displays all the stars that are most likely in binary systems. Right: radial velocity measurements from DR3 (y-axis) as a function of radial velocity measurements from DR2 (x-axis) using the same color-coding. |
4.2. Renormalized unit weight error
The Gaia data product known as the renormalized unit weight error (RUWE) is a measure that is used to filter out sources with potentially poor astrometry, in particular, spurious parallaxes or proper motions (see for details Lindegren et al. 2018). The RUWE is expected to be about 1.0 for sources where the single-star model provides a good fit to the astrometric observations. If a value is significantly greater than 1.0, it might indicate that the source is not a single object or otherwise problematic for the astrometric solution. Therefore, we used the RUWE to search for low-mass RG binary candidates in our sample. We examined the RUWE measurements of the known RG binaries, and we found that 93% of the known binary systems have a RUWE larger than 1.4. Therefore, we used RUWE ≥ 1.4 as a threshold to consider the object a binary candidate.
To set this in a perspective, we plot known binary systems as well as observed stars with CORALIE and FEROS in the AEN and RUWE parameter space to indicate our selection threshold in Fig. 2. The gray shaded area depicts the systems that are potential binaries based on our selection criteria. Figure 2 shows that all known binaries lie in the gray shaded area.
4.3. Radial velocities from CORALIE, FEROS, DR2, and DR3
In order to define the binary fraction in our observed sample, we made use of the radial velocity measurements from CORALIE, FEROS, Gaia DR2, and DR3. The RV measurements from DR2 and DR3 are depicted in Fig. 2 (right panel), where we show known binaries with filled blue circles and observed stars with open blue circles. Figure 2 (right panel) shows that the DR2 and DR3 measurements do not differ.
With CORALIE, we obtained two different epochs of spectra (ΔCRV) for 38 stars. They are reported in Table 4, where we also listed the AEN value and the corresponding uncertainty. When the difference in ΔCRV ≥ 0.1 km s−1, we considered it as a potential binary candidate. Out of these 38 observed objects, ΔCRV is above the threshold for 17 stars. They might therefore be potential binary systems.
We obtained a single-epoch CORALIE spectrum for 44 stars, which were combined with RV measurements from Gaia DR2 in order to measure RV differences. Likewise, single-epoch archival FEROS spectra for 6 stars were combined with RV measurements from Gaia DR2. In Table 5 we list the difference between the CORALIE/FEROS RV and the DR2 RV measurements (ΔRV) of all the single-epoch observed stars from the ground together with their AEN and RUWE. Because the errors in Gaia DR2 measurements vary from 0.2 to 2.5 km s−1, we used the 3σ criterion as the threshold. In other words, if the RV difference between ground-based and DR2 RV measurements is three times greater than its RV error, we consider the object a potential binary candidate.
Binary classification of low-mass red giant stars reported in this paper with single CORALIE or FEROS epoch spectra.
4.4. Classification
By combining three sets of measurements, that is, the AEN, RUWE, and RV measurements, we defined three categories that classify a star by its likelihood to be a binary candidate. The stars that were observed from the ground are divided into three categories. The stars for which at least two of the parameters (AEN/RUWE and RV variation) were larger that the threshold were classified as binary candidates and were assigned category 1. The stars for which one of the parameters was above the threshold (AEN, RUWE, or RV variation) were assigned category 2 as they are likely to be binary candidates. The third group (category 3) includes targets without significant AEN, RUWE, or large RV variations.
In the observed set, 24 stars show AEN ≥ 0.4, 18 of which also present significant radial velocity variations. These 18 stars were assigned category 1 as they are binary candidates that will be priority targets for follow-up observations. Furthermore, 18 stars are potential binary candidates (category 2), 13 of which show only significant RV variations, and 5 stars only show astrometric excess noise above a threshold of 0.4 mas. These 18 stars were also added to the follow-up observations because additional observations are needed to confirm their binarity.
Furthermore, three stars (HD 119483, HD 149649, and CD-397574) that were observed with CORALIE in two epochs show RV variations of 0.061, 0.046, and −0.046 km s−1, respectively. As these variations are just below the RV threshold of 0.1 km s−1, we marked these stars as potential follow-up candidates. Moreover, the target HD 120144 has an RUWE of 1.37, but shows neither AEN nor RV variation. We consider this target a possible binary candidate (category 2) that should also be observed in the future.
Last, using the same classification method, we classified six FEROS targets that were obtained from the ESO archive. One of them corresponds to a binary system listed in the Gaia DR3 catalog, and one other was classified category 1, that is, it is most likely a binary candidate.
5. Conclusion and future prospects
Based on the Gaia DR2 color-magnitude diagram, we selected a sample of 211 low-mass RG candidates within 200 pc in order to search for low-mass RGB + MS binary systems with orbital periods between 100 and 900 days, which are potential progenitors of wide binary sdB systems. From the literature, we found 24 such systems. Furthermore, 9 long-period (248–898 days) binary systems were identified with orbital parameters from DR3. In addition, we obtained CORALIE spectroscopic data for 82 stars and single-epoch FEROS archive spectra for 6 stars in this sample. We combined the resulting CORALIE and FEROS RVs with the DR2 and DR3 radial velocity measurements and with the AEN and RUWE values to search for potential binary candidates. From these combined datasets, we defined three different categories based on their likelihood of being a binary candidate. The first group includes binary candidates because they have a strong RV variation and a high AEN. The second group contains likely binary candidates because they show either high RV or their AEN values lie above the threshold. The third group includes stars that show neither RV nor AEN variations, which accounts for 53% of the observed sample, or 47 stars. The observed sample demonstrates that 47% of the observed stars (41 out of 88) most likely have binary signatures. This result is expected considering that about half of the low-mass main sequence stars are found in binary systems (Raghavan et al. 2010).
In future work, we will continue observing the selected binary candidates to confirm their binarity and constrain their orbital parameters. Furthermore, the spectra that we obtained will be used to derive accurate atmospheric parameters, including the effective temperature, surface gravity, rotational velocity, microturbulence, and metallicity. We will also derive accurate radii and masses by deriving the radius from an SED fit for the stars that are presented in this work. We note that our sample might be contaminated by the red clump (RC) stars, and this contamination can be up to 30%, as shown by Girardi (2016). Removing this contamination to define the low-mass RG stars is difficult because they cannot be distinguished by color-magnitude diagrams or spectroscopic surveys (e.g., Masseron & Hawkins 2017). The way to distinguish these two groups is to use asteroseismology. For instance, Bedding et al. (2011) showed that the seismic parameter called period spacing can be used to distinguish RGB stars, which burn only hydrogen in the shell, from RC stars, which burn helium in their cores as well. In the future, we will make use of this advanced technique using high-precision photometry for the targets that have been observed during the TESS and K2 missions. Several ongoing large-scale, ground-based surveys are ongoing that focus on obtaining high-resolution spectroscopy, including GALAH (12 ≤ V ≤ 14), SDSS V (11 ≤ H ≤ 14), and Gaia-ESO (variable brightness ranges). These surveys will be important to constrain the orbital parameters of promising targets that are classified category 1 and 2 in this work.
Acknowledgments
We thank the referee for her or his helpful comments which led to an improved presentation of our results. M.U. acknowledges financial support from CONICYT Doctorado Nacional in the form of grant number No: 21190886 and ESO studentship program. M.V. acknowledges support from the grant FONDECYT REGULAR No: 1211941. J.V. acknowledges support from the Grant Agency of the Czech Republic (GAČR 22-34467S). The Astronomical Institute Ondřejov is supported by the project RVO:67985815. A.B. acknowledges support for this project from the European Union’s Horizon 2020 research and innovation program under grant agreement No. 865932-ERC-SNeX. Based on observations collected with the CORALIE echelle spectrograph on the 1.2-m Euler Swiss Telescope at La Silla Observatory under the program allocated by the Chilean Time Allocation Committee (CNTAC), no: CN2019A-58, CN2019B-87, CN2020B-77, CN2022A-82. This work has made use of data from the European Space Agency (ESA) mission Gaia (https://www.cosmos.esa.int/Gaia), processed by the Gaia Data Processing and Analysis Consortium (DPAC, https://www.cosmos.esa.int/web/Gaia/dpac/consortium). Funding for the DPAC has been provided by national institutions, in particular the institutions participating in the Gaia Multilateral Agreement.
References
- Bedding, T. R., Mosser, B., Huber, D., et al. 2011, Nature, 471, 608 [Google Scholar]
- Bianchi, L., Herald, J., Efremova, B., et al. 2011, Ap&SS, 335, 161 [Google Scholar]
- Bluhm, P., Jones, M. I., Vanzi, L., et al. 2016, A&A, 593, A133 [NASA ADS] [CrossRef] [EDP Sciences] [Google Scholar]
- Brahm, R., Jordán, A., & Espinoza, N. 2017, PASP, 129, 034002 [Google Scholar]
- Choi, J., Dotter, A., Conroy, C., et al. 2016, ApJ, 823, 102 [Google Scholar]
- Copperwheat, C. M., Morales-Rueda, L., Marsh, T. R., Maxted, P. F. L., & Heber, U. 2011, MNRAS, 415, 1381 [Google Scholar]
- Dai, M., Chen, X., Wang, K., et al. 2022, Res. Astron. Astrophys., 22, 035022 [CrossRef] [Google Scholar]
- Dorman, B., & Rood, R. T. 1993, ApJ, 409, 387 [NASA ADS] [CrossRef] [Google Scholar]
- Gaia Collaboration (Babusiaux, C. et al.) 2018, A&A, 616, A10 [NASA ADS] [CrossRef] [EDP Sciences] [Google Scholar]
- Gaia Collaboration (Creevey, O. L., et al.) 2022, A&A, in press, https://doi.org/10.1051/0004-6361/202243800 [Google Scholar]
- Gandhi, P., Buckley, D. A. H., Charles, P. A., et al. 2022, MNRAS, 510, 3885 [CrossRef] [Google Scholar]
- Girardi, L. 2016, ARA&A, 54, 95 [Google Scholar]
- Han, Z., Podsiadlowski, P., Maxted, P. F. L., Marsh, T. R., & Ivanova, N. 2002, MNRAS, 336, 449 [Google Scholar]
- Han, Z., Podsiadlowski, P., Maxted, P. F. L., & Marsh, T. R. 2003, MNRAS, 341, 669 [NASA ADS] [CrossRef] [Google Scholar]
- Heber, U. 2016, PASP, 128, 082001 [Google Scholar]
- Jones, M. I., Jenkins, J. S., Rojo, P., & Melo, C. H. F. 2011, A&A, 536, A71 [NASA ADS] [CrossRef] [EDP Sciences] [Google Scholar]
- Kupfer, T., Geier, S., Heber, U., et al. 2015, A&A, 576, A44 [NASA ADS] [CrossRef] [EDP Sciences] [Google Scholar]
- Lindegren, L., Hernández, J., Bombrun, A., et al. 2018, A&A, 616, A2 [NASA ADS] [CrossRef] [EDP Sciences] [Google Scholar]
- Massarotti, A., Latham, D. W., Stefanik, R. P., & Fogel, J. 2008, AJ, 135, 209 [Google Scholar]
- Masseron, T., & Hawkins, K. 2017, A&A, 597, L3 [NASA ADS] [CrossRef] [EDP Sciences] [Google Scholar]
- Maxted, P. F. L., Heber, U., Marsh, T. R., & North, R. C. 2001, MNRAS, 326, 1391 [CrossRef] [Google Scholar]
- Molina, F., Vos, J., Németh, P., et al. 2022, A&A, 658, A122 [NASA ADS] [CrossRef] [EDP Sciences] [Google Scholar]
- Murakami, H., Baba, H., Barthel, P., et al. 2007, PASJ, 59, S369 [CrossRef] [Google Scholar]
- Napiwotzki, R., Karl, C. A., Lisker, T., et al. 2004, Ap&SS, 291, 321 [NASA ADS] [CrossRef] [Google Scholar]
- Németh, P., Vos, J., Molina, F., & Bastian, A. 2021, A&A, 653, A3 [Google Scholar]
- Neugebauer, G., Habing, H. J., van Duinen, R., et al. 1984, ApJ, 278, L1 [NASA ADS] [CrossRef] [Google Scholar]
- Otani, T., Lynas-Gray, A. E., Kilkenny, D., et al. 2022, ApJ, 926, 17 [NASA ADS] [CrossRef] [Google Scholar]
- Paczynski, B. 1976, in Structure and Evolution of Close Binary Systems, eds. P. Eggleton, S. Mitton, & J. Whelan, 73, 75 [NASA ADS] [CrossRef] [Google Scholar]
- Queloz, D., Mayor, M., Udry, S., et al. 2001, The Messenger, 105, 1 [NASA ADS] [Google Scholar]
- Raghavan, D., McAlister, H. A., Henry, T. J., et al. 2010, ApJS, 190, 1 [Google Scholar]
- Ren, J. J., Raddi, R., Rebassa-Mansergas, A., et al. 2020, ApJ, 905, 38 [NASA ADS] [CrossRef] [Google Scholar]
- Schaffenroth, V., Barlow, B. N., Geier, S., et al. 2019, A&A, 630, A80 [NASA ADS] [CrossRef] [EDP Sciences] [Google Scholar]
- Setiawan, J., Pasquini, L., da Silva, L., et al. 2004, A&A, 421, 241 [Google Scholar]
- Soto, M. G., Jones, M. I., & Jenkins, J. S. 2021, A&A, 647, A157 [NASA ADS] [CrossRef] [EDP Sciences] [Google Scholar]
- Taylor, M. B. 2005, in ASP Conf. Ser., 347, 29 [Google Scholar]
- Vos, J., Østensen, R. H., Marchant, P., & Van Winckel, H. 2015, A&A, 579, A49 [NASA ADS] [CrossRef] [EDP Sciences] [Google Scholar]
- Vos, J., Vučković, M., Chen, X., et al. 2019, MNRAS, 482, 4592 [NASA ADS] [CrossRef] [Google Scholar]
- Vos, J., Bobrick, A., & Vučković, M. 2020, A&A, 641, A163 [NASA ADS] [CrossRef] [EDP Sciences] [Google Scholar]
- Webbink, R. F. 1984, ApJ, 277, 355 [NASA ADS] [CrossRef] [Google Scholar]
- Wenger, M., Ochsenbein, F., Egret, D., et al. 2000, A&AS, 143, 9 [NASA ADS] [CrossRef] [EDP Sciences] [Google Scholar]
- Wittenmyer, R. A., Endl, M., Wang, L., et al. 2011, ApJ, 743, 184 [NASA ADS] [CrossRef] [Google Scholar]
- Wittenmyer, R. A., Liu, F., Wang, L., et al. 2016, AJ, 152, 19 [NASA ADS] [CrossRef] [Google Scholar]
- Wittenmyer, R. A., Butler, R. P., Horner, J., et al. 2020, MNRAS, 491, 5248 [NASA ADS] [CrossRef] [Google Scholar]
- Wright, E. L., Eisenhardt, P. R. M., Mainzer, A. K., et al. 2010, AJ, 140, 1868 [Google Scholar]
- Yılmaz, M., Sato, B., Bikmaev, I., et al. 2017, A&A, 608, A14 [NASA ADS] [CrossRef] [EDP Sciences] [Google Scholar]
Appendix A: Radial velocity measurements
Radial velocity measurements for all stars that are presented in this work.
Radial velocity measurements for all stars that are presented in this work.
All Tables
Observing log of the spectroscopic data obtained for the low-mass red giant stars.
Binary classification of low-mass red giant stars reported in this paper with two CORALIE epoch spectra.
Binary classification of low-mass red giant stars reported in this paper with single CORALIE or FEROS epoch spectra.
All Figures
|
Fig. 1. Left: color-magnitude diagram of all low-mass (0.7 − 2.3 M⊙) RG candidates within 200 pc (blue dots) from Gaia DR2 for the southern hemisphere stars. As a comparison, the Gaia DR2 color-magnitude diagram of the 100 pc clean sample (sample C in Lindegren et al. 2018) is shown in gray. The slightly larger gray dots within the selected sample represent the low-mass RG candidates within 500 pc. The red circles show the low-mass RG candidates that were observed with EULER/CORALIE. Right: sky locations (Galactic coordinates, Aitoff projection) of the volume-limited low-mass RG sample within 200 pc with respect to the galactic coordinate system use the same color-coding. |
| In the text | |
|
Fig. 2. Left: AEN vs. RUWE, including known binaries from the literature and DR3 (filled blue circles) and observed stars (open blue circles). AEN of 0.4 mas is represented by the horizontal dashed black line, and RUWE of 1.4 is represented by the vertical dashed black line. The gray shaded area displays all the stars that are most likely in binary systems. Right: radial velocity measurements from DR3 (y-axis) as a function of radial velocity measurements from DR2 (x-axis) using the same color-coding. |
| In the text | |
Current usage metrics show cumulative count of Article Views (full-text article views including HTML views, PDF and ePub downloads, according to the available data) and Abstracts Views on Vision4Press platform.
Data correspond to usage on the plateform after 2015. The current usage metrics is available 48-96 hours after online publication and is updated daily on week days.
Initial download of the metrics may take a while.