Fig. 1.
Download original image
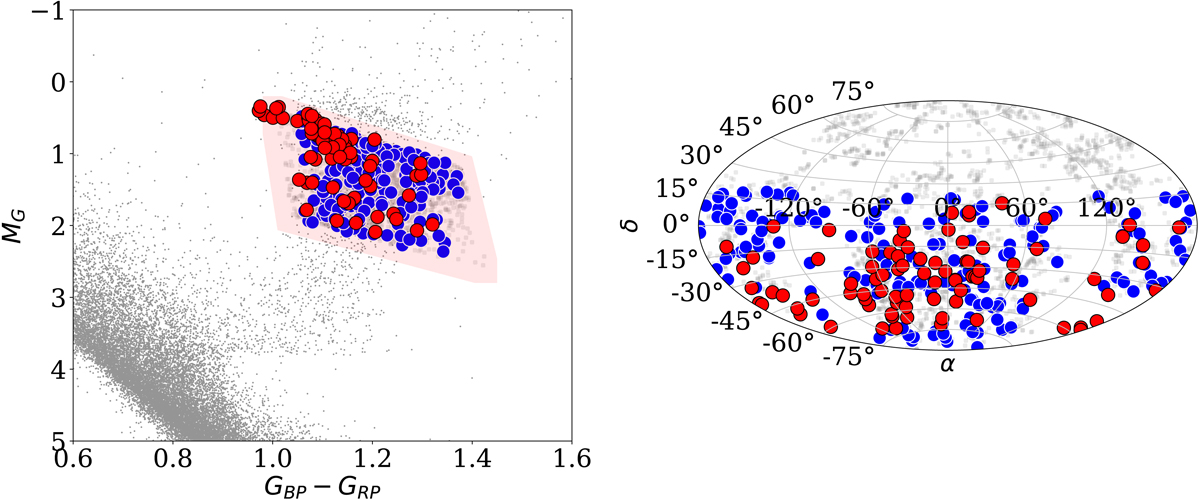
Left: color-magnitude diagram of all low-mass (0.7 − 2.3 M⊙) RG candidates within 200 pc (blue dots) from Gaia DR2 for the southern hemisphere stars. As a comparison, the Gaia DR2 color-magnitude diagram of the 100 pc clean sample (sample C in Lindegren et al. 2018) is shown in gray. The slightly larger gray dots within the selected sample represent the low-mass RG candidates within 500 pc. The red circles show the low-mass RG candidates that were observed with EULER/CORALIE. Right: sky locations (Galactic coordinates, Aitoff projection) of the volume-limited low-mass RG sample within 200 pc with respect to the galactic coordinate system use the same color-coding.
Current usage metrics show cumulative count of Article Views (full-text article views including HTML views, PDF and ePub downloads, according to the available data) and Abstracts Views on Vision4Press platform.
Data correspond to usage on the plateform after 2015. The current usage metrics is available 48-96 hours after online publication and is updated daily on week days.
Initial download of the metrics may take a while.