Fig. 2.
Download original image
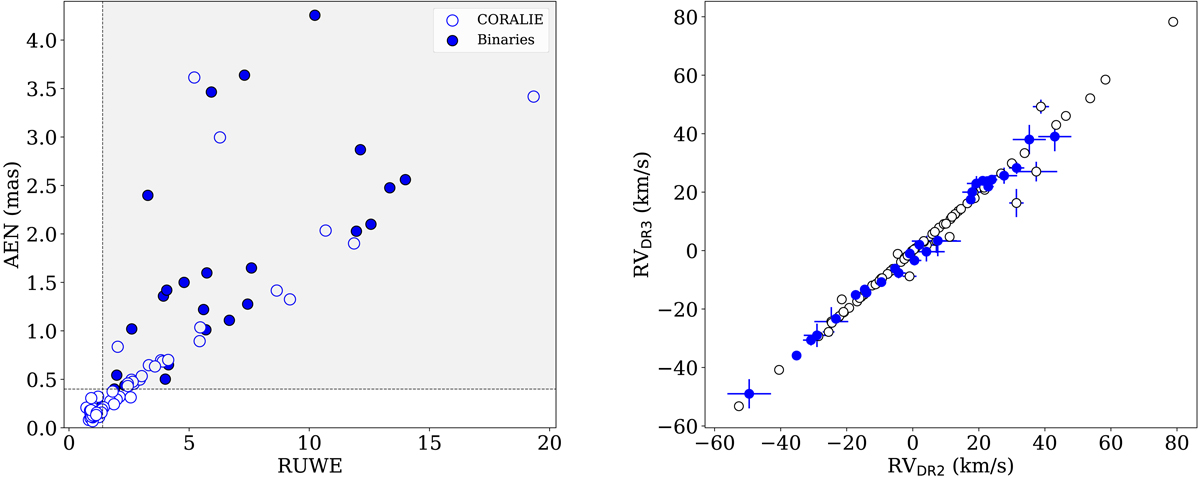
Left: AEN vs. RUWE, including known binaries from the literature and DR3 (filled blue circles) and observed stars (open blue circles). AEN of 0.4 mas is represented by the horizontal dashed black line, and RUWE of 1.4 is represented by the vertical dashed black line. The gray shaded area displays all the stars that are most likely in binary systems. Right: radial velocity measurements from DR3 (y-axis) as a function of radial velocity measurements from DR2 (x-axis) using the same color-coding.
Current usage metrics show cumulative count of Article Views (full-text article views including HTML views, PDF and ePub downloads, according to the available data) and Abstracts Views on Vision4Press platform.
Data correspond to usage on the plateform after 2015. The current usage metrics is available 48-96 hours after online publication and is updated daily on week days.
Initial download of the metrics may take a while.