| Issue |
A&A
Volume 673, May 2023
|
|
|---|---|---|
| Article Number | A12 | |
| Number of page(s) | 10 | |
| Section | Extragalactic astronomy | |
| DOI | https://doi.org/10.1051/0004-6361/202245405 | |
| Published online | 26 April 2023 | |
MaNGA integral-field stellar kinematics of LoTSS radio galaxies: Luminous radio galaxies tend to be slow rotators
1
Leiden Observatory, Leiden University, PO Box 9513, 2300 RA Leiden, The Netherlands
e-mail: This email address is being protected from spambots. You need JavaScript enabled to view it.
2
Sterrenkundig Observatorium, Department of Physics and Astronomy, Ghent University, Belgium
3
Max-Planck Institut für Astronomie, Königstuhl 17, 69117 Heidelberg, Germany
4
Sub-department of Astrophysics, Department of Physics, University of Oxford, Denys Wilkinson Building, Keble Road, Oxford OX1 3RH, UK
Received:
8
November
2022
Accepted:
16
March
2023
Abstract
The radio jets of an active galactic nucleus (AGN) can heat up the gas around a host galaxy and quench star formation activity. The presence of a radio jet could be related to the evolutionary path of the host galaxy and may be imprinted in the morphology and kinematics of the galaxy. In this work, we use data from the Sloan Digital Sky Survey’s Mapping Nearby Galaxies at Apache Point Observatory survey and the Low Frequency Array (LOFAR) Two-Metre Sky Survey as well as the National Radio Astronomy Observatory (NRAO) the Karl G. Jansky Very Large Array (VLA) Sky Survey and the Faint Images of the Radio Sky at Twenty Centimeter survey. We combine these integral field spectroscopic data and radio data to study the link between stellar kinematics and radio AGNs. We find that the luminosity-weighted stellar angular momentum λRe is tightly related to the range of radio luminosity and the fraction of radio AGNs Fradio present in galaxies, as high-luminosity radio AGNs are only in galaxies with a small λRe, and the Fradio at a fixed stellar mass decreases with λRe. These results indicate that galaxies with stronger random stellar motions with respect to the ordered motions might be better breeding grounds for powerful radio AGNs. This would also imply that the merger events of galaxies are important in the triggering of powerful radio jets in our sample.
Key words: galaxies: active / galaxies: kinematics and dynamics / quasars: supermassive black holes / galaxies: jets / radio continuum: galaxies
© The Authors 2023
 Open Access article, published by EDP Sciences, under the terms of the Creative Commons Attribution License (https://creativecommons.org/licenses/by/4.0), which permits unrestricted use, distribution, and reproduction in any medium, provided the original work is properly cited.
This article is published in open access under the Subscribe to Open model. This email address is being protected from spambots. You need JavaScript enabled to view it. to support open access publication.
1. Introduction
A supermassive black hole (SMBH) actively accreting materials in a galaxy’s centre is an active galactic nucleus (AGN). An AGN emits a large amount of energy and severely impacts the star-formation in its host galaxy (see Cattaneo et al. 2009; Fabian 2012, and references therein). Some AGNs are bright in radio bands and have prominent jet features. These AGNs are called ‘radio AGNs’. They usually reside in the centre of massive early-type galaxies (ETG; Condon & Dressel 1978; Balick & Heckman 1982; Best et al. 2005b; Brown et al. 2011). The radio jets can heat up the intergalactic materials around and therefore lower the supply of cooling gas for star-formation in their host galaxies (Best et al. 2006; Dunn & Fabian 2006; McNamara & Nulsen 2007; Fabian 2012). Although radio AGNs can be important for the evolution of galaxies, it is unclear why some galaxies contain radio AGNs and others do not. To address this radio AGN-triggering problem, we investigate links between radio AGNs and the properties of their host galaxies.
An intriguing fact about radio AGNs and their host galaxies is that the prevalence of radio AGNs is closely related to the morphology of galaxies. Barišić et al. (2019) show the fraction of radio AGNs in early-type galaxies increases with the optical axis ratio of galaxies using data from the Sloan Digital Sky Survey (SDSS; York et al. 2000; Stoughton et al. 2002), the National Radio Astronomy Observatory (NRAO) the Karl G. Jansky Very Large Array (VLA) Sky Survey (NVSS; Condon et al. 2002), and the Faint Images of the Radio Sky at Twenty Centimeter survey (FIRST; Becker et al. 1995). This trend has also been confirmed for the high-luminosity radio AGNs (L150 MHz ≳ 1023 W Hz−1) in Zheng et al. (2020) using the first data release of the LOFAR Two-metre Sky Survey (LoTSS DR1; Shimwell et al. 2019). When taking the general changes in morphology as a function of stellar mass (M⋆) into account in these works, the radio AGN-morphology relation cannot be explained by the trend that more massive galaxies are more likely to be round (van der Wel et al. 2009; Chang et al. 2013). The radio AGN-morphology relation probably implies that high-power radio jets preferentially exist in galaxies with a merger-dominant history, which are more likely to be round. This interpretation is in line with the results from the decomposition of the optical light profile of radio galaxies (Wang et al. 2016, 2019) and deep imaging (Tadhunter 2016; Pierce et al. 2019), where the host galaxies of high-luminosity radio AGNs show more post-merger features than their low-luminosity counterparts.
We note that the link between radio AGNs and galaxy morphology is luminosity dependent. Zheng et al. (2020) indicated that the fraction of galaxies hosting low-luminosity (L150 MHz ≲ 1023 W Hz−1) radio AGNs does not depend on the axis ratio of galaxies. A large fraction of low-luminosity radio AGNs show no morphological signs of merging events and have disc-like components in optical images (e.g., Wang et al. 2019; Pierce et al. 2019). Therefore, it has been suggested that high- and low-luminosity radio AGNs may be triggered in different ways.
The radio luminosity-morphology relation may be explained by the spin paradigm (Blandford & Znajek 1977; Wilson & Colbert 1995; Sikora et al. 2007; Fanidakis et al. 2011; Chen et al. 2021). As described in Blandford & Znajek (1977), the spin of an SMBH is an essential ingredient in the jet-launching process. Numerical simulations have shown that both accretion processes and black hole mergers can change the spin of SMBHs (Fanidakis et al. 2011; Dubois et al. 2014; Bustamante & Springel 2019). The black hole merger was believed to be an efficient way to make a high-spin SMBH (Wilson & Colbert 1995; Sikora et al. 2007; Fanidakis et al. 2011) and led to the conclusion that merged SMBHs are more likely to launch radio jets. Although this hypothesis has been challenged by both observational and numerical works (Garofalo et al. 2010; Reynolds 2013; Dubois et al. 2014; Bustamante & Springel 2019; Sayeb et al. 2021, see Sect. 4 for more discussion), it is still reasonable to suggest that SMBHs in galaxies without mergers in their evolution path would have different spins than those in galaxies with a merger-driven history because the merging of galaxies would be followed by the merging of SMBHs.
When deep images are not available, it is difficult to verify whether a galaxy has a merger-dominant history with traditional imaging because of projection effects. Integral field spectroscopic (IFS) observation, which can resolve the stellar velocity field in galaxies, presents a good way of overcoming this difficulty. The pioneering work of Smith et al. (1990) has shown that the stellar dynamics of galaxies can indeed provide valuable clues for studying the triggering of powerful radio AGNs. Recently, IFS surveys such as the ATLAS3D survey (Cappellari et al. 2011a), the Calar Alto Legacy Integral Field Area survey (Sánchez et al. 2012), and the Mapping Nearby Galaxies at APO (MaNGA; Bundy et al. 2015) survey have greatly improved our understanding about the structure and stellar kinematics of galaxies. These surveys have shown that ETGs can be separated into two categories, fast rotators (FRs) and slow rotators (SRs), based on stellar kinematics (see Cappellari 2016, and references therein). The FRs have disc-like structures and rotation-dominated kinematics, while the SRs have no disc and random motion dominated kinematics. The structure and stellar kinematics of these galaxies indicate their evolutionary paths. Because disc structure can be easily preserved or rebuilt in gas-rich processes, such as gas accretion and wet mergers, SRs are most likely the products of major dry mergers, after which the stellar discs are disrupted and not enough gas is available to rebuild them (Bender et al. 1992; Emsellem et al. 2011; Bois et al. 2011; Lauer 2012; Cappellari 2016).
The FR-SR dichotomy seems to directly relate to the morphological difference in high- and low-luminosity radio AGNs. In this work, we combine the observational results from MaNGA and LoTSS to investigate the stellar kinematics of high- and low-luminosity radio AGNs. This can help verify the link between radio jets and a galaxy’s evolution path. This article is organised as follows: We describe our sample in Sect. 2. The analyses and results are shown in Sect. 3. In Sect. 4, we summarise the main findings of this work. The cosmology adopted throughout the work is H0 = 70 km s−1 Mpc−1, ΩM = 0.3, ΩΓ = 0.7.
2. Data and sample
The IFS data in this work are from the MaNGA Data Release 16 (DR16; Ahumada et al. 2020). The MaNGA survey uses the intergral field units (IFUs) equipped by the Baryon Oscillation Spectroscopic Survey (BOSS) spectrographs on the 2.5-metre Sloan Telescope (Smee et al. 2013). These IFUs have 19–127 hexagonally bundled 2″ fibres corresponding to diameters of 12″ to 32″. The final spectra provided by the MaNGA covers wavelengths from 360 to 1000 nm, with a resolution of R ∼ 2000 (Law et al. 2016). The MaNGA DR16 contains a total of 4597 galaxies from an extended version of the NASA-Sloan Atlas (NSA1). These galaxies are selected to have a flat number density distribution in the i-band absolute magnitude within 0.01 < z < 0.15 (Wake et al. 2017). This selection strategy ensures that the galaxy sample has a flat stellar mass distribution between 109 − 1012 M⊙. Galaxies in the primary and secondary samples of MaNGA are mapped by IFUs out to 1.5 and 2.5 effective radii (Re), respectively.
The kinematic and morphological parameters of the MaNGA galaxies were measured by Graham et al. (2019, hereafter G19) and tabulated in Bevacqua et al. (2022). These galaxies were flagged based on the criteria in Graham et al. (2018) to exclude problematic data, merging sources that have hard to define morphological parameters and sources too small with respect to the point spreading function of the Sloan Telescope. After the exclusion of these sources, the rest of the galaxies formed the ‘clean’ sample, as defined in G19, which comprises 4003 sources. These galaxies all have reliable kinematic and morphological measurements. The galaxies used in our analysis are all from the clean sample.
To study the stellar kinematics of the galaxies, G19 measured the luminosity-weighted stellar angular momentum within one Re (λRe), defined in Emsellem et al. (2007),
 (1)
(1)
where Fn, Rn, Vn, and σn are respectively the flux, projected radius, projected stellar velocity, and velocity dispersion of the n-th spatial bin. The typical error of λRe in the catalogue is less than 0.05 (Graham et al. 2018). The galaxies with ellipticity ϵ < 0.4 and λRe < 0.08 + ϵ/4 were classified as SRs, while the others were classified as FRs (Emsellem et al. 2011; Cappellari 2016; Graham et al. 2018).
To identify the radio AGNs in the MaNGA sample, we used the data from the LoTSS Data release two (DR2; Shimwell et al. 2019). The LoTSS DR2 covers 27% of the northern sky at 120–169 MHz. This survey achieves a median sensitivity of 83 μJy beam−1 and an astrometric accuracy of 0.2″ at 6″ resolution for bright sources. A total of 4396228 radio sources were detected in LoTSS DR2. Because of the high sensitivity and the large sky coverage, LoTSS DR2 is expected to have many low-luminosity radio AGNs, which makes it a good dataset for our work.
We used the cross-matching results from Mulcahey et al. (2022, hereafter M22) to classify the radio AGNs in the MaNGA sample. M22 used a 5″-matching radius to match the positions in the source catalogues of the MaNGA and LoTSS DR2. This matching resulted in a radio sample of 1410 MaNGA sources with a false positive rate of less than 10%. At low luminosity, the contribution of star-forming galaxies in a radio source sample becomes important (Best & Heckman 2012, hereafter BH12; Sabater et al. 2019). Therefore, M22 separated these radio sources into radio AGNs and star-forming galaxies based on four diagnostics: the Dn 4000 − L150 MHz/M∗ diagram; the [NII] Baldwin, Phillips, and Telervich (BPT; Baldwin et al. 1981) diagram; LHα − L150 MHz; and the colour from the Wide-Field Infrared Survey Explorer (WISE; Wright et al. 2010). This classification process was performed for LoTSS DR1, and the contamination rate from star-forming galaxies was estimated to be less than 3% (Sabater et al. 2019). Combining the results from M22 and G19, we obtained a clean MaNGA-radio AGN sample that consists of 300 radio AGNs with reliable stellar kinematic measurements. We also obtained a total of 2796 galaxies in G19’s clean sample that fall into the field of view (FoV) of the LoTSS DR2.
We note that the simple cross-matching process may miss some luminous radio AGNs that can have a large angular size in the sky. Moreover, some MaNGA sources are outside the FoV of LoTSS DR2. Therefore, we also matched the MaNGA sample with the radio sources catalogue provided in BH12, which is based on the NVSS-FIRST data and the SDSS data release 7 (DR7; Abazajian et al. 2009). This added 1090 galaxies covered by the FoV of SDSS DR7 from G19’s clean sample. The radio catalogue from BH12 used a more careful hybrid cross-matching method in the identification of optical counterparts (Best et al. 2005a; Donoso et al. 2009). This dataset has a radio flux limit of 5 mJy and mainly contains radio sources with L1.4 GHz > 1023 W Hz−1. The radio AGNs in this catalogue and in M22 are classified in a similar way (see Appendix 1 in BH12). In this way, we obtained 49 more radio AGNs with kinematic measurements. Therefore, our final sample contains 3886 galaxies, of which 349 are radio AGNs.
The radio luminosity and stellar mass distributions of our final radio AGN sample are shown in Fig. 1. The stellar masses used in this work are taken from the source catalogue of G19, which is based on the calibration of the dynamical mass against the K-band luminosity of Cappellari (2013). The radio luminosities were determined using the redshifts taken from NSA and a canonical radio spectral index of 0.7. The majority of the radio AGNs are within M⋆ = 1011 − 1012.5 M⊙ and L150 MHz = 1021 − 1024 W Hz−1. Over 86% of these radio AGNs are hosted by passive galaxies based on the colour-colour criteria in Chang et al. (2015) (u − r > 1.6 × (r − z)+1.1). Nearly all the radio AGNs identified in BH12 are above L150 MHz = 1023 W Hz−1 and therefore complement the LoTSS DR2 sample, which has only a very small number of sources at high luminosity, and improve the coverage of the L150 MHz-z plane for the more luminous sources. The rotator type of each source is also marked in Fig. 1. No significant trend between the rotator type and radio luminosity was found.
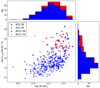 |
Fig. 1. Radio luminosity and stellar mass distributions of the final radio AGN sample in this work. The blue data points and histograms represent the 300 radio AGNs from the M22 sample based on LoTSS DR2. The red data points and bars stacked on the blue histograms denote the other 49 radio AGNs identified in BH12. We use circles and crosses to mark the SRs and FRs, respectively, classified by G19. |
3. Data analysis
3.1. The ϵ and λRe of galaxies hosting a radio AGN
Previous studies have found that the radio luminosity distribution of radio AGNs is linked with the optical projected axis ratio q (the ratio of the minor axis to the major axis; Zheng et al. 2020, 2022). Galaxies with a large q (> 0.6) can host a high-power radio AGN with L150 MHz ≳ 1023.5 W Hz−1, while galaxies with a small q host radio AGNs mostly with a lower radio luminosity. This trend can be seen in the radio AGNs’ distribution on the L150 MHz-q plane, where most radio AGNs are distributed in a triangle area and leave the small-q-high-L150 MHz region empty (see Fig. 3 in Zheng et al. 2020).
The radio AGNs in this work should follow the L150 MHz-q distribution found in previous works. We selected radio AGNs from three M⋆ bins with a high number of sources: log(M⋆/M⊙) = 11.2 − 11.5, 11.5 − 11.8, and > 11.8. The total number of radio AGNs and galaxies within the M⋆ ranges is 302 and 1379, respectively. The number of sources in each of these three bins is listed in Table 1. Because M⋆ is correlated to both the radio luminosity and the morphology of galaxies (Chang et al. 2013; Sabater et al. 2019), constraining the M⋆ range is necessary to show a pure luminosity-morphology correlation. In the catalogue from G19, the ϵ of galaxies was provided and can be written as ϵ = 1 − q. The resulting distributions of radio AGNs in the L150 MHz-ϵ plane in the three M⋆ bins are shown in the upper panels of Fig. 2.
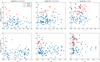 |
Fig. 2. L150 MHz of radio AGNs versus the ϵ and λRe of their host galaxies. The top panels show the L150 MHz of radio AGNs as a function of the ϵ of the host galaxies in three M⋆ bins (from left to right): log(M⋆/M⊙) = 11.2 − 11.5, 11.5 − 1.8, and > 11.8. The bottom panels show the L150 MHz as a function of the λRe of the host galaxies in three M⋆ bins. In all panels, the blue points denote radio AGNs from M22, and the red points denote radio AGNs from the BH12 sample. |
In the first M⋆ bin, while 13 of the 72 radio AGNs with L150 MHz < 1023.5 W Hz−1 have a large ellipticity ϵ > 0.4, none of radio AGNs with higher luminosity have a large ellipticity. This means that a high-power radio AGN is not likely to reside in an elongated galaxy, which is in line with previous studies (Barišić et al. 2019; Zheng et al. 2020). We note that this difference between high- and low-power radio AGNs does not seem to be significant in higher M⋆ bins. This is mainly because most of the massive galaxies are round elliptical galaxies with a small ϵ. In our sample, more than 90% of the galaxies with M⋆ > 1011.8 M⊙ have an ϵ smaller than 0.4.
The apparent ellipticity of galaxies can greatly differ from the intrinsic ellipticity because of projection effects (Binney 1985). Therefore, the observed ϵ is not an ideal proxy for the kinematics of galaxies. To better describe the kinematic features of galaxies, we use λRe, which quantifies the importance of the regular motions with respect to the random motion of stars in galaxies by definition.
We plotted the radio AGNs in the three M⋆ bins on the L150 MHz-λRe plane, shown in the bottom panels of Fig. 2. The distribution of the radio AGNs is clearly characterised by a triangle zone with nearly no radio AGNs appearing in the large-λRe-high-L150 MHz area. The maximum L150 MHz of radio AGNs decreases dramatically with λRe in all three M⋆ bins. In the first M⋆ bin, the fraction of large λRe (λRe > 0.4) sources is 0/4 for radio AGNs with L150 MHz > 1024 W Hz−1 and 47/74 for those with lower luminosity. These fractions become 1/15 versus 35/102 in the second bin and 0/41 versus 11/65 in the third bin. This result indicates that the radio AGNs with L150 MHz > 1024 W Hz−1 in our sample are triggered in galaxies with λRe ≲ 0.4. Furthermore, the comparison between the L150 MHz-ϵ and L150 MHz-λRe diagrams implies that the L150 MHz-λRe relation is a powerful tool for studying the intrinsic relations between radio AGNs and the kinematics of their host galaxies.
In summary, we show the location of the radio AGNs in the ϵ-λRe plane in Fig. 3. Apparently, luminous radio AGNs tend to be in SRs, which have both a small ϵ and λRe. On the contrary, less luminous radio AGNs can be found in many FRs. The fractions of SRs in high-power AGNs are  2,
2,  , and
, and  in the three bins, while the fractions in low-power AGNs are
  ,
,  , and
, and  . In all three bins, high-power radio AGNs have a significantly higher fraction of SRs in contrast to low-power radio AGNs. Because SRs have been argued to have a dry-merger dominant history, in contrast to FRs, we suggest that the difference in the ϵ-λRe distributions of high- and low-luminosity radio AGNs at fixed M⋆ stems from the different evolutionary paths of the host galaxies.
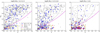 |
Fig. 3. Distributions of galaxies and radio AGN in the ϵ-λRe plane. From left to right, the three panels show the distributions of galaxies in three M⋆ bins: log(M⋆/M⊙) = 11.2 − 11.5, 11.5 − 1.8, and > 11.8. The total number of AGNs and galaxies within these M⋆ ranges are 302 and 1329, respectively. The source number in each M⋆ bin is listed in Table 1. The blue and red crosses mark the radio AGNs with log(L150 MHz) = 21 − 24 and > 24, and the grey points denote the galaxies within the corresponding M⋆ bin. The yellow lines denote the separation of SRs and FRs proposed by Cappellari (2016). The magenta line shows the estimated λRe of edge-on FR galaxies with maximum anisotropy δ = 0.7ϵintr described in Cappellari et al. (2007), where ϵintri denotes the intrinsic ellipticity. The grey dashed and dotted lines show the λRe for FRs with different inclinations and ϵintr, respectively. |
3.2. Prevalence of radio AGNs
When inspecting the distributions of galaxies and radio AGNs in the ϵ-λRe plane in Fig. 3, we found that more massive galaxies have a higher fraction of radio AGNs and have a higher radio luminosity. This is in line with previous studies based on large radio surveys (e.g., Best et al. 2005b; Sabater et al. 2019) that showed that the fraction of galaxies hosting a radio AGN, Fradio, is tightly related to stellar mass and radio luminosity. Figure 3 also shows that the fraction of high-luminosity radio AGNs seems to decrease with either λRe or ϵ, which is consistent with the correlations between Fradio and the shape of galaxies in Barišić et al. (2019) and Zheng et al. (2020). In this section, we investigate these trends with a focus on how the kinematics of galaxies may influence Fradio.
We define Fradio as
 (2)
(2)
where NradioAGN is the number of radio AGNs identified in either the M22 or BH12 sample, Ngalaxy is the number of galaxies covered by the FoV of the LoTSS DR2 or the SDSS DR7, and θi denotes an arbitrary parameter constraint in the source selection (e.g., M⋆, L150 MHz, λRe). We note that our Fradio results should only be taken as an accurate measurement for the prevalence of radio AGNs if the sensitivity variation across the FoV and the change in the detectability of certain galaxies at different redshifts are considered in the calculation. As we do not do so, our results may differ from those of previous works (Best et al. 2005b; Sabater et al. 2019). However, in this work we focus on the relative change of Fradio in galaxies with different kinematics, and this change should not be influenced by these factors. Our simple estimation of Fradio should be adequate for the goals in this paper.
We first divided the sources into two groups with different ϵ and compared the Fradio-M⋆ relations within the two groups. We choose ϵ = 0.3 as the division line because it is roughly where the radio luminosity distribution changes, as shown in Fig. 2. This ϵ = 0.3 division also ensures the group with a larger ϵ has enough sources for the Fradio calculations. We calculated the Fradio in five logarithmic, equidistant M⋆ bins between 1010.5 to 1012.5 M⊙. The results are shown in the top-left panel of Fig. 4. The error bars are the 1σ Agresti-Coull confidence limit (Agresti & Coull 1998). To investigate how the radio AGN-morphology relation changes with radio luminosity, we further calculated the Fradio for low- and high-luminosity radio AGNs with L150 MHz lower and higher than 1023.5 W Hz−1 and show the Fradio in the top-middle and top-right panels of Fig. 4.
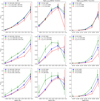 |
Fig. 4. Fradio-M⋆ relations in different galaxies. From left to right, the three panels in each row show the Fradio for all radio AGNs, radio AGNs with L150 MHz < 1023.5 W Hz−1, and radio AGNs with L150 MHz ≥ 1023.5 W Hz−1. Top row: Fradio-M⋆ relations for galaxies with different ϵ. The blue squares denote the Fradio for all galaxies, and the green points and red dots denote the Fradio for galaxies with ϵ < 0.3 and ϵ > 0.3, respectively. The three lines were shifted a bit horizontally for clarity. Middle row: Fradio-M⋆ relations for galaxies with different λRe. The blue squares denote the Fradio for all galaxies, and the green points and red dots denote the Fradio for galaxies with λRe < 0.2 and λRe > 0.2, respectively. Bottom row: Fradio-M⋆ relations for galaxies with different rotator types. The blue squares denote the Fradio for all galaxies, and the green points and red dots denote the Fradio for SRs and FRs, respectively. The number of AGNs used in each Fradio relation is listed in the corresponding panel. The number of galaxies used in the Fradio calculations is listed in the left panel of each row, and the Fradio in the middle and right panels was calculated based on the same galaxy sample as in the left panels. All error bars are the 1σ Agresti-Coull confidence limits (Agresti & Coull 1998). |
The Fradio for all radio AGNs in both the large- and small-ϵ groups follow the canonical increasing trend with M⋆ (Best et al. 2005a; Sabater et al. 2019). The Fradio of the large-ϵ galaxies are slightly smaller than those of the small-ϵ galaxies in most bins. However, these differences do not seem to be significant, as they are typically within the 1σ error bars. This result is in line with the findings in Zheng et al. (2020), where the Fradio of oblate galaxies are close to the Fradio of triaxial galaxies. The marginal differences between the Fradio of large- and small-ϵ galaxies are also present in the results for high- and low-luminosity radio AGNs. Although in the most massive bin the large-ϵ galaxies have a higher Fradio for high-luminosity radio AGNs, the number of sources in the bin is too small for this result to be significant.
We then separated the sources into two groups based on the λRe to investigate the Fradio-M⋆ relation for galaxies with different kinematics. We chose λRe = 0.2 as the dividing line based on the L150 MHz-λRe distribution in Fig. 2. The Fradio results are shown in the middle row of Fig. 4.
Based on Fig. 4, it is apparent that the low-λRe galaxies have a significantly higher Fradio than the high-λRe galaxies in almost all M⋆ bins with reliable Fradio results (small error bars). Moreover, this trend does not change for radio AGNs with different radio luminosities. This result shows that both low- and high-luminosity radio AGNs are more likely to be triggered in galaxies with a low-λRe.
Finally, we also separated the sources based on their rotator type in G19. We show the results in the bottom row of Fig. 4. The results are largely similar to those of the λRe groups. This is because the SRs are all low-λRe galaxies by definition.
To understand in more detail the Fradio dependence on galaxy morphology and kinematics, we also calculated the Fradio as a function of either ϵ or λRe. We chose galaxies with M⋆ values ranging from 1011 to 1012 M⊙ where the sample has a large source number and shows the largest difference in Fradio for galaxies with different ϵ or λRe in Fig. 4. To enlarge the source number in each bin and reduce the error bars of the Fradio, we split the sources into two M⋆ groups, one with log(M⋆ /M⊙) = 11 − 11.5 and another with11.5 − 12, and we calculated the Fradio in five equidistant ϵ or λRe bins. We only included sources with ϵ = 0 − 0.8 and λRe = 0 − 0.9 because the number of sources with large ϵ and λRe is very low. The number of AGNs in these two groups is 108 and 186, respectively, and the number of galaxies is 902 and 667, respectively. The Fradio results are shown in the top panels of Fig. 5.
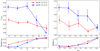 |
Fig. 5. Fradio for galaxies with different morphologies and kinematics. Top: Fradio as a function of ϵ and λRe for galaxies with different M⋆. The red dots and blue squares represent galaxies with log(M⋆ /M⊙) = 11 − 11.5 and 11.5 − 12, respectively. Bottom: Median λRe for galaxies in each ϵ bin and the median ϵ in each λRe bin. The red lines were shifted horizontally a bit for clarity. |
For the Fradio-ϵ relation, the Fradio shows a weak decreasing trend in the low-M⋆ group. In the high-M⋆ groups, the Fradio does not change until ϵ = 0.4, where it then drops dramatically. This may explain the marginal differences in the Fradio for the large- and small-ϵ galaxies in Fig. 4, where a division line of ϵ = 0.3 was adopted. We note that the Fradio-ϵ relation for the high-M⋆ galaxies is not directly in line with the Fradio-q relations in Barišić et al. (2019) or Zheng et al. (2020), as the Fradio-q relation in Barišić et al. (2019) did not have a plateau and the Fradio was not dependent on q in Zheng et al. (2020). A likely reason for this difference is that the three works use different sample criteria. Both Barišić et al. (2019) and Zheng et al. (2020) used mass-limited quiescent (non-star-forming) galaxy samples in their analyses, while Zheng et al. (2020) used radio AGNs with a much lower luminosity limit than Barišić et al. (2019). In our work, to enlarge the sample size, we included as many sources as possible regardless of M⋆ limits, colours, or radio luminosity limits. Therefore, the Fradio-ϵ relation in this work is not, or only partially, in line with previous works.
In the top-right panel of Fig. 5, the Fradio of high-M⋆ galaxies decreases monotonically with λRe. For low-M⋆ galaxies, the Fradio-λRe relation also shows a weak, decreasing trend despite small fluctuations. Based on these results, we conclude that radio AGNs are triggered more easily in galaxies with stronger random stellar motions (i.e. galaxies that have weaker stellar disc components).
3.3. Observed vs. reproduced Fradio relations
In the previous section, we show that Fradio is anti-correlated with both ϵ and λRe. However, the morphologies and kinematics of galaxies are related to each other. For FRs, as shown in Fig. 3, a large ϵ typically indicates the presence of a prominent disc component and a large λRe (see Eqs. (14)–(18) in Cappellari 2016). Above a characteristic mass of about 2 × 10¹¹ M⊙, galaxies start to be dominated by SRs, which have been assembled through dry mergers (see review Cappellari 2016, Sect. 7). The kinematics of SRs tend to be dominated by random motions. They do not have stellar discs and intrinsically have ϵ ≲ 0.4 in projection. Therefore, when plotting the median λRe or ϵ in each bin of Fig. 5 as a function of the other parameter in the bottom panels of Fig. 5, we observed clear increasing trends. These trends imply that the two Fradio relations actually reflect the same intrinsic link between jet-triggering probability and galaxy structure or evolutionary path. In this section, we discuss which parameter is the better proxy of the intrinsic Fradio relation.
Because the two Fradio relations are connected by the correlation of ϵ and λRe, one of the Fradio relations may be reproduced by the other. We first assumed that ϵ is a better predictor of Fradio, and we expected that the Fradio-λRe relations could be reproduced by the Fradio-ϵ relation. We interpolated the observed Fradio-ϵ relation to obtain a continuous function  . This function served as input as the ‘intrinsic’ probability of a galaxy with ϵ hosting a radio AGN. Next, we obtained the expected radio-loud probabilities for galaxies in each λRe bin based on their ϵ and
  . The average of these expected probabilities was taken as the ϵ-reproduced fraction of radio AGNs Fradio, repro in the corresponding λRe bin. We changed the role of ϵ and λRe in order to obtain the λRe-reproduced Fradio in each ϵ bin. We present the ratio between the observed fraction of radio AGNs Fradio, obs and Fradio, repro in Fig. 6.
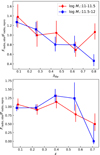 |
Fig. 6. Ratio of the observed and reproduced Fradio. Top: Fradio ratio as a function of λRe. The colours and symbols are similar to Fig. 5. Bottom: Fradio ratio as a function of ϵ. All red lines are shifted a bit horizontally. |
If any of the Fradio relations can be predicted by the other Fradio relation and the ϵ-λRe relation, we expected that the reproduced Fradio would be close to the observed value, and the decreasing trend in the Fradio relation would disappear in the Fradio ratio diagrams. In the top panel of Fig. 6, the Fradio ratio Fradio, obs/Fradio, repro for the high-M⋆ sample still shows a decreasing trend with λRe. This means that the Fradio-ϵ relation cannot reproduce the Fradio-λRe relation. Therefore, ϵ is not sufficient for showing the intrinsic link between Fradio and galaxy structure. In contrast, the Fradio, obs/Fradio, repro-λRe relation for the low-M⋆ sample (top panel of Fig. 6) and the Fradio, obs/Fradio, repro-ϵ relation for both samples (bottom panel of Fig. 6) do not simply decline. This implies that λRe might be a good proxy for the intrinsic link between Fradio and galaxy structure in both samples. In the low-M⋆ sample, ϵ might also be used as a proxy, but it would be less robust than λRe.
We note that the binning of data may weaken the significance of the analysis, and therefore we also compared the observed and reproduced cumulative distribution of radio AGNs. The observed cumulative distribution of radio AGNs as a function of parameter θ (ϵ or λRe) Cum(θ) is the number of radio AGNs with θi less than a given value as below:
 (3)
(3)
where H(x) is the Heaviside step function and the summation is for all radio AGNs. The reproduced cumulative distribution of radio AGNs as a function of λRe using  can be calculated as
 (4)
(4)
where the summation is over all galaxies in the sample. Similarly, Cumrepro(ϵ) can be obtained using  .
.
The cumulative distributions of radio AGNs for the two M⋆ groups are shown in Fig. 7. The reproductions of the cumulative distributions clearly have different levels of goodness. For Cum(λRe), the distributions reproduced from  are significantly different from the observed distributions. On the contrary, the reproduced cumulative distributions Cumrepro(ϵ) based on
  fit the observed distributions well.
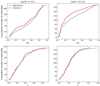 |
Fig. 7. Cumulative distributions of radio AGNs. Top: comparisons between the observed cumulative distributions of radio AGNs as a function of λRe and the ϵ-reproduced distributions. Bottom: comparisons between the observed cumulative distributions of radio AGNs as a function of ϵ and the λRe-reproduced distributions. |
These results show that the Fradio-λRe relation describes the intrinsic links between radio jets and host galaxies better than the Fradio-ϵ relation. Because λRe is a better proxy of the stellar kinematics of galaxies, this implies the triggering of radio AGNs is related to galaxy kinematics and assembly history. Furthermore, the Fradio-λRe and Fradio-ϵ relations should reveal the same underlying relation between radio AGNs and host galaxies because the Fradio-ϵ relation can be reproduced by the Fradio-λRe relations. However, ϵ is more easily affected by the inclination of galaxies, and this should explain the inability of the Fradio-ϵ to predict the Fradio-λRe well.
4. Conclusion and discussion
In this work, we combined the morphology and kinematic measurements for galaxies in the MaNGA survey with the data of radio AGNs from LoTSS DR2 and the NVSS-FIRST survey. We investigated the relations between radio AGNs and the kinematics of their host galaxies in M⋆ constrained samples. The main new findings in this article are briefly listed below:
-
The radio luminosity of a radio AGN depends on the λRe of the host galaxy in our sample. Higher-luminosity radio AGNs could be hosted by galaxies with lower λRe at fixed M⋆.
-
The fraction of galaxies hosting a radio AGN is higher in galaxies with smaller λRe in our sample. This trend is similar for both high- and low-L150 MHz radio AGNs.
-
The Fradio-λRe relation cannot be well reproduced using the Fradio-ϵ, while the Fradio-ϵ relation can be reproduced by the Fradio-λRe relation. This shows that the Fradio-λRe relation better describes the links between radio AGNs and host galaxies in our sample.
The dependence on λRe for radio AGNs in our work implies that the build-up history of galaxies could be related to the presence of radio jets. Because λRe quantifies the importance of the regular circular motion in a galaxy (in contrast to random motion), it is an indicator of the evolutionary path of the galaxy (Emsellem et al. 2007, 2011; Cappellari 2016). For galaxies built-up mainly from secular star forming processes, the ordered stellar motions are retained, and the stellar disc components are dominant in the galaxy structure; thus, the resulting λRe would not be very small. These galaxies are FRs. In contrast, SRs are likely to have a dry-major-merger dominated history, which would have led to the destruction of stellar discs and the enhancement of the random motions (i.e. a small λRe). Therefore, the fact that high-L150 MHz radio AGNs favour small-λRe galaxies suggests that a merger history enhances the radio AGN activities.
We stress that this does not mean that all current high-luminosity radio AGNs are triggered directly by ongoing merger events, but a merger event in the past would make a galaxy become a breeding ground for powerful radio jets. The heritage of a merger event may influence a radio AGN’s activity in at least two ways. Studies based on deep imaging (Tadhunter 2016; Pierce et al. 2019; Ramos Almeida et al. 2011) have shown that most of the galaxies with a radio-powerful AGN have past interaction signatures. The existence of these signatures may enhance gas inflow in the galaxy, facilitating fuelling of the central SMBH. However, this may not be the only reason for the L150 MHz-λRe dependence because secular processes may also form structures that benefit the gas inflow and could be responsible for all radiative mode AGNs (see e.g., Heckman & Best 2014; Sellwood 2014, for more details). Another consequence of a major merger event is the impact on the black hole spin. As mentioned in Sect. 1, it was suggested that a major merger could be an efficient way to make a high-spin black hole (Wilson & Colbert 1995; Moderski & Sikora 1996; Sikora et al. 2007; Fanidakis et al. 2011; Barišić et al. 2019) because the orbital angular momentum of the two progenitor SMBHs would transfer to the spin of the merged black hole. However, this theory might not be fully correct. Numerical simulations have shown that SMBHs reach their highest spin through coherent accretion processes at high redshifts when they have enough gas supply, and the merging of SMBHs at low redshifts would decrease the spin (Dubois et al. 2014; Bustamante & Springel 2019). The observational data also indicate that massive SMBHs might rotate more slowly than low-mass SMBHs (Reynolds 2013). These results would suggest that mergers do not enhance jet-launching processes by making a high-spin SMBH. It is more likely that mergers change the direction of the spin of SMBHs and influence the probability of launching a radio jet. Garofalo et al. (2010, 2020) indicated that radio jets are more powerful in counter-rotating disc systems, which can only exist in post-merger black holes. A counter-rotating disc system can also help form a magnetically arrested disc, which is crucial for launching a powerful jet (Tchekhovskoy & McKinney 2012; Sikora & Begelman 2013; Rusinek et al. 2020). Therefore, we suggest that mergers can lead to a change in the black hole spin direction and boost the probability of producing a powerful jet. As a result, small-λRe galaxies (or SRs) can launch a powerful jet more easily than large-λRe galaxies (or FRs).
The Fradio-ϵ relation shows an overall decreasing trend but with a plateau at the small-ϵ part. We note that this trend is not fully consistent with previous research on the axis ratio of galaxies (Barišić et al. 2019; Zheng et al. 2020). A possible reason for this disparity is the difference in selection criteria of these works. Previous works were limited to colour-selected quiescent galaxies, which would exclude a large fraction of discy galaxies. This limitation causes large uncertainties in the Fradio results for the large-ϵ (small-q) galaxies. However, the sample studied in this work is mainly composed of passive galaxies, and the Fradio-ϵ relation in this work does not change significantly when only the passive galaxies are included. The M⋆ limit adopted in the sample selection of Barišić et al. (2019) and Zheng et al. (2020) may also be a reason for our different results.
The link between the evolutionary path of galaxies and the presence of radio jets might also be related to the environment. First, environment richness is correlated with many important properties of galaxies. Galaxies in clusters tend to be more massive and are more likely to be elliptical galaxies than those in the field (see Blanton & Moustakas 2009; Conselice 2014, and references therein). Slow rotators also favour high density environments (Cappellari et al. 2011b). Second, the environment is connected to the prevalence and power of radio jets. Galaxies in cluster environments have a higher probability to be radio-loud than galaxies with a similar stellar mass in the field (Best et al. 2005b, 2007; Sabater et al. 2013). Radio AGNs also tend to have higher luminosity in higher density environments (Donoso et al. 2009; Croston et al. 2019). These results and the correlations between radio AGNs and galaxy kinematics in our work can be understood within the same scenario. We suggest the environmental trend of radio AGNs might be a result of the correlation between radio AGNs and galaxy kinematics. Galaxies in higher density environments are more likely to have a merger-dominant evolutionary history; thus, they are also more likely to be SRs, or low-λRe galaxies (Cappellari et al. 2011b; Cappellari 2016). Based on the results in our work, it is therefore not surprising that we can find more high-power radio AGNs in higher density environments.
Our work shows the potential of IFS surveys for studying the radio AGN-triggering mechanism. To better understand the link between radio AGNs and galaxy kinematics, it will be important to increase the sample in the next generation of IFS surveys. It will also be helpful to study the gas kinematics in these radio galaxies with deeper observations, which may provide important insights on the fuelling of the SMBHs.
The errors of these fractions show the 1σ Agresti-Coull confidence limits (Agresti & Coull 1998).
Acknowledgments
We thank Celia Mulcahey and Sarah Leslie for providing the MaNGA-LoTSS AGN sample. LOFAR data products were provided by the LOFAR Surveys Key Science project (LSKSP; https://lofar-surveys.org/) and were derived from observations with the International LOFAR Telescope (ILT). LOFAR (van Haarlem et al. 2013) is the Low Frequency Array designed and constructed by ASTRON. It has observing, data processing, and data storage facilities in several countries, that are owned by various parties (each with their own funding sources), and that are collectively operated by the ILT foundation under a joint scientific policy. The efforts of the LSKSP have benefited from funding from the European Research Council, NOVA, NWO, CNRS-INSU, the SURF Co-operative, the UK Science and Technology Funding Council and the Jülich Supercomputing Centre. XCZ acknowledges support from the CSC (China Scholarship Council)-Leiden University joint scholarship program.
References
- Abazajian, K. N., Adelman-McCarthy, J. K., Agüeros, M. A., et al. 2009, ApJS, 182, 543 [Google Scholar]
- Agresti, A., & Coull, B. A. 1998, Am. Stat., 52, 119 [Google Scholar]
- Ahumada, R., Prieto, C. A., Almeida, A., et al. 2020, ApJS, 249, 3 [Google Scholar]
- Baldwin, J. A., Phillips, M. M., & Terlevich, R. 1981, PASP, 93, 5 [Google Scholar]
- Balick, B., & Heckman, T. M. 1982, ARA&A, 20, 431 [NASA ADS] [CrossRef] [Google Scholar]
- Barišić, I., van der Wel, A., van Houdt, J., et al. 2019, ApJ, 872, L12 [CrossRef] [Google Scholar]
- Becker, R. H., White, R. L., & Helfand, D. J. 1995, ApJ, 450, 559 [Google Scholar]
- Bender, R., Burstein, D., & Faber, S. M. 1992, ApJ, 399, 462 [NASA ADS] [CrossRef] [Google Scholar]
- Best, P. N., & Heckman, T. M. 2012, MNRAS, 421, 1569 [NASA ADS] [CrossRef] [Google Scholar]
- Best, P. N., Kauffmann, G., Heckman, T. M., & Ivezić, Ž. 2005a, MNRAS, 362, 9 [Google Scholar]
- Best, P. N., Kauffmann, G., Heckman, T. M., et al. 2005b, MNRAS, 362, 25 [Google Scholar]
- Best, P. N., Kaiser, C. R., Heckman, T. M., & Kauffmann, G. 2006, MNRAS, 368, L67 [NASA ADS] [Google Scholar]
- Best, P. N., von der Linden, A., Kauffmann, G., Heckman, T. M., & Kaiser, C. R. 2007, MNRAS, 379, 894 [Google Scholar]
- Bevacqua, D., Cappellari, M., & Pellegrini, S. 2022, MNRAS, 511, 139 [NASA ADS] [CrossRef] [Google Scholar]
- Binney, J. 1985, MNRAS, 212, 767 [NASA ADS] [Google Scholar]
- Blandford, R. D., & Znajek, R. L. 1977, MNRAS, 179, 433 [NASA ADS] [CrossRef] [Google Scholar]
- Blanton, M. R., & Moustakas, J. 2009, ARA&A, 47, 159 [Google Scholar]
- Bois, M., Emsellem, E., Bournaud, F., et al. 2011, MNRAS, 416, 1654 [Google Scholar]
- Brown, M. J. I., Jannuzi, B. T., Floyd, D. J. E., & Mould, J. R. 2011, ApJ, 731, L41 [Google Scholar]
- Bundy, K., Bershady, M. A., Law, D. R., et al. 2015, ApJ, 798, 7 [Google Scholar]
- Bustamante, S., & Springel, V. 2019, MNRAS, 490, 4133 [CrossRef] [Google Scholar]
- Cappellari, M. 2013, ApJ, 778, L2 [NASA ADS] [CrossRef] [Google Scholar]
- Cappellari, M. 2016, ARA&A, 54, 597 [Google Scholar]
- Cappellari, M., Emsellem, E., Bacon, R., et al. 2007, MNRAS, 379, 418 [Google Scholar]
- Cappellari, M., Emsellem, E., Krajnović, D., et al. 2011a, MNRAS, 413, 813 [Google Scholar]
- Cappellari, M., Emsellem, E., Krajnović, D., et al. 2011b, MNRAS, 416, 1680 [Google Scholar]
- Cattaneo, A., Faber, S. M., Binney, J., et al. 2009, Nature, 460, 213 [NASA ADS] [CrossRef] [Google Scholar]
- Chang, Y.-Y., van der Wel, A., Rix, H.-W., et al. 2013, ApJ, 773, 149 [NASA ADS] [CrossRef] [Google Scholar]
- Chang, Y.-Y., van der Wel, A., da Cunha, E., & Rix, H.-W. 2015, ApJS, 219, 8 [Google Scholar]
- Chen, Y., Gu, Q., Fan, J., et al. 2021, ApJ, 913, 93 [NASA ADS] [CrossRef] [Google Scholar]
- Condon, J. J., & Dressel, L. L. 1978, ApJ, 221, 456 [NASA ADS] [CrossRef] [Google Scholar]
- Condon, J. J., Cotton, W. D., & Broderick, J. J. 2002, AJ, 124, 675 [Google Scholar]
- Conselice, C. J. 2014, ARA&A, 52, 291 [CrossRef] [Google Scholar]
- Croston, J. H., Hardcastle, M. J., Mingo, B., et al. 2019, A&A, 622, A10 [NASA ADS] [CrossRef] [EDP Sciences] [Google Scholar]
- Donoso, E., Best, P. N., & Kauffmann, G. 2009, MNRAS, 392, 617 [Google Scholar]
- Dubois, Y., Volonteri, M., Silk, J., Devriendt, J., & Slyz, A. 2014, MNRAS, 440, 2333 [Google Scholar]
- Dunn, R. J. H., & Fabian, A. C. 2006, MNRAS, 373, 959 [Google Scholar]
- Emsellem, E., Cappellari, M., Krajnović, D., et al. 2007, MNRAS, 379, 401 [Google Scholar]
- Emsellem, E., Cappellari, M., Krajnović, D., et al. 2011, MNRAS, 414, 888 [Google Scholar]
- Fabian, A. C. 2012, ARA&A, 50, 455 [Google Scholar]
- Fanidakis, N., Baugh, C. M., Benson, A. J., et al. 2011, MNRAS, 410, 53 [NASA ADS] [CrossRef] [Google Scholar]
- Garofalo, D., Evans, D. A., & Sambruna, R. M. 2010, MNRAS, 406, 975 [NASA ADS] [Google Scholar]
- Garofalo, D., North, M., Belga, L., & Waddell, K. 2020, ApJ, 890, 144 [NASA ADS] [CrossRef] [Google Scholar]
- Graham, M. T., Cappellari, M., Li, H., et al. 2018, MNRAS, 477, 4711 [Google Scholar]
- Graham, M. T., Cappellari, M., Bershady, M. A., & Drory, N. 2019, ArXiv e-prints [arXiv:1910.05139] [Google Scholar]
- Heckman, T. M., & Best, P. N. 2014, ARA&A, 52, 589 [Google Scholar]
- Lauer, T. R. 2012, ApJ, 759, 64 [NASA ADS] [CrossRef] [Google Scholar]
- Law, D. R., Cherinka, B., Yan, R., et al. 2016, AJ, 152, 83 [Google Scholar]
- McNamara, B. R., & Nulsen, P. E. J. 2007, ARA&A, 45, 117 [NASA ADS] [CrossRef] [Google Scholar]
- Moderski, R., & Sikora, M. 1996, A&AS, 120, 591 [NASA ADS] [Google Scholar]
- Mulcahey, C. R., Leslie, S. K., Jackson, T. M., et al. 2022, A&A, 665, A144 [NASA ADS] [CrossRef] [EDP Sciences] [Google Scholar]
- Pierce, J. C. S., Tadhunter, C. N., Ramos Almeida, C., Bessiere, P. S., & Rose, M. 2019, MNRAS, 487, 5490 [NASA ADS] [CrossRef] [Google Scholar]
- Ramos Almeida, C., Tadhunter, C. N., Inskip, K. J., et al. 2011, MNRAS, 410, 1550 [NASA ADS] [Google Scholar]
- Reynolds, C. S. 2013, CQG, 30, 244004 [NASA ADS] [CrossRef] [Google Scholar]
- Rusinek, K., Sikora, M., Kozieł-Wierzbowska, D., & Gupta, M. 2020, ApJ, 900, 125 [NASA ADS] [CrossRef] [Google Scholar]
- Sabater, J., Best, P. N., & Argudo-Fernández, M. 2013, MNRAS, 430, 638 [Google Scholar]
- Sabater, J., Best, P. N., Hardcastle, M. J., et al. 2019, A&A, 622, A17 [NASA ADS] [CrossRef] [EDP Sciences] [Google Scholar]
- Sánchez, S. F., Kennicutt, R. C., Gil de Paz, A., et al. 2012, A&A, 538, A8 [Google Scholar]
- Sayeb, M., Blecha, L., Kelley, L. Z., et al. 2021, MNRAS, 501, 2531 [CrossRef] [Google Scholar]
- Sellwood, J. A. 2014, Rev. Mod. Phys., 86, 1 [Google Scholar]
- Shimwell, T. W., Tasse, C., Hardcastle, M. J., et al. 2019, A&A, 622, A1 [NASA ADS] [CrossRef] [EDP Sciences] [Google Scholar]
- Sikora, M., & Begelman, M. C. 2013, ApJ, 764, L24 [NASA ADS] [CrossRef] [Google Scholar]
- Sikora, M., Stawarz, Ł., & Lasota, J.-P. 2007, ApJ, 658, 815 [NASA ADS] [CrossRef] [Google Scholar]
- Smee, S. A., Gunn, J. E., Uomoto, A., et al. 2013, AJ, 146, 32 [Google Scholar]
- Smith, E. P., Heckman, T. M., & Illingworth, G. D. 1990, ApJ, 356, 399 [NASA ADS] [CrossRef] [Google Scholar]
- Stoughton, C., Lupton, R. H., Bernardi, M., et al. 2002, AJ, 123, 485 [Google Scholar]
- Tadhunter, C. 2016, A&ARv, 24, 10 [Google Scholar]
- Tchekhovskoy, A., & McKinney, J. C. 2012, MNRAS, 423, L55 [NASA ADS] [CrossRef] [Google Scholar]
- van der Wel, A., Rix, H.-W., Holden, B. P., Bell, E. F., & Robaina, A. R. 2009, ApJ, 706, L120 [NASA ADS] [CrossRef] [Google Scholar]
- van Haarlem, M. P., Wise, M. W., Gunst, A. W., et al. 2013, A&A, 556, A2 [NASA ADS] [CrossRef] [EDP Sciences] [Google Scholar]
- Wake, D. A., Bundy, K., Diamond-Stanic, A. M., et al. 2017, AJ, 154, 86 [Google Scholar]
- Wang, J., Xu, Y., Xu, D. W., & Wei, J. Y. 2016, ApJ, 833, L2 [NASA ADS] [CrossRef] [Google Scholar]
- Wang, J., Kong, M.-Z., Liu, S.-F., et al. 2019, Res. Astron. Astrophys., 19, 144 [CrossRef] [Google Scholar]
- Wilson, A. S., & Colbert, E. J. M. 1995, ApJ, 438, 62 [NASA ADS] [CrossRef] [Google Scholar]
- Wright, E. L., Eisenhardt, P. R. M., Mainzer, A. K., et al. 2010, AJ, 140, 1868 [Google Scholar]
- York, D. G., Adelman, J., Anderson, J. E. Jr., et al. 2000, AJ, 120, 1579 [Google Scholar]
- Zheng, X. C., Röttgering, H. J. A., Best, P. N., et al. 2020, A&A, 644, A12 [NASA ADS] [CrossRef] [EDP Sciences] [Google Scholar]
- Zheng, X. C., Röttgering, H. J. A., van der Wel, A., & Duncan, K. 2022, A&A, 665, A114 [NASA ADS] [CrossRef] [EDP Sciences] [Google Scholar]
All Tables
All Figures
|
Fig. 1. Radio luminosity and stellar mass distributions of the final radio AGN sample in this work. The blue data points and histograms represent the 300 radio AGNs from the M22 sample based on LoTSS DR2. The red data points and bars stacked on the blue histograms denote the other 49 radio AGNs identified in BH12. We use circles and crosses to mark the SRs and FRs, respectively, classified by G19. |
| In the text | |
|
Fig. 2. L150 MHz of radio AGNs versus the ϵ and λRe of their host galaxies. The top panels show the L150 MHz of radio AGNs as a function of the ϵ of the host galaxies in three M⋆ bins (from left to right): log(M⋆/M⊙) = 11.2 − 11.5, 11.5 − 1.8, and > 11.8. The bottom panels show the L150 MHz as a function of the λRe of the host galaxies in three M⋆ bins. In all panels, the blue points denote radio AGNs from M22, and the red points denote radio AGNs from the BH12 sample. |
| In the text | |
|
Fig. 3. Distributions of galaxies and radio AGN in the ϵ-λRe plane. From left to right, the three panels show the distributions of galaxies in three M⋆ bins: log(M⋆/M⊙) = 11.2 − 11.5, 11.5 − 1.8, and > 11.8. The total number of AGNs and galaxies within these M⋆ ranges are 302 and 1329, respectively. The source number in each M⋆ bin is listed in Table 1. The blue and red crosses mark the radio AGNs with log(L150 MHz) = 21 − 24 and > 24, and the grey points denote the galaxies within the corresponding M⋆ bin. The yellow lines denote the separation of SRs and FRs proposed by Cappellari (2016). The magenta line shows the estimated λRe of edge-on FR galaxies with maximum anisotropy δ = 0.7ϵintr described in Cappellari et al. (2007), where ϵintri denotes the intrinsic ellipticity. The grey dashed and dotted lines show the λRe for FRs with different inclinations and ϵintr, respectively. |
| In the text | |
|
Fig. 4. Fradio-M⋆ relations in different galaxies. From left to right, the three panels in each row show the Fradio for all radio AGNs, radio AGNs with L150 MHz < 1023.5 W Hz−1, and radio AGNs with L150 MHz ≥ 1023.5 W Hz−1. Top row: Fradio-M⋆ relations for galaxies with different ϵ. The blue squares denote the Fradio for all galaxies, and the green points and red dots denote the Fradio for galaxies with ϵ < 0.3 and ϵ > 0.3, respectively. The three lines were shifted a bit horizontally for clarity. Middle row: Fradio-M⋆ relations for galaxies with different λRe. The blue squares denote the Fradio for all galaxies, and the green points and red dots denote the Fradio for galaxies with λRe < 0.2 and λRe > 0.2, respectively. Bottom row: Fradio-M⋆ relations for galaxies with different rotator types. The blue squares denote the Fradio for all galaxies, and the green points and red dots denote the Fradio for SRs and FRs, respectively. The number of AGNs used in each Fradio relation is listed in the corresponding panel. The number of galaxies used in the Fradio calculations is listed in the left panel of each row, and the Fradio in the middle and right panels was calculated based on the same galaxy sample as in the left panels. All error bars are the 1σ Agresti-Coull confidence limits (Agresti & Coull 1998). |
| In the text | |
|
Fig. 5. Fradio for galaxies with different morphologies and kinematics. Top: Fradio as a function of ϵ and λRe for galaxies with different M⋆. The red dots and blue squares represent galaxies with log(M⋆ /M⊙) = 11 − 11.5 and 11.5 − 12, respectively. Bottom: Median λRe for galaxies in each ϵ bin and the median ϵ in each λRe bin. The red lines were shifted horizontally a bit for clarity. |
| In the text | |
|
Fig. 6. Ratio of the observed and reproduced Fradio. Top: Fradio ratio as a function of λRe. The colours and symbols are similar to Fig. 5. Bottom: Fradio ratio as a function of ϵ. All red lines are shifted a bit horizontally. |
| In the text | |
|
Fig. 7. Cumulative distributions of radio AGNs. Top: comparisons between the observed cumulative distributions of radio AGNs as a function of λRe and the ϵ-reproduced distributions. Bottom: comparisons between the observed cumulative distributions of radio AGNs as a function of ϵ and the λRe-reproduced distributions. |
| In the text | |
Current usage metrics show cumulative count of Article Views (full-text article views including HTML views, PDF and ePub downloads, according to the available data) and Abstracts Views on Vision4Press platform.
Data correspond to usage on the plateform after 2015. The current usage metrics is available 48-96 hours after online publication and is updated daily on week days.
Initial download of the metrics may take a while.