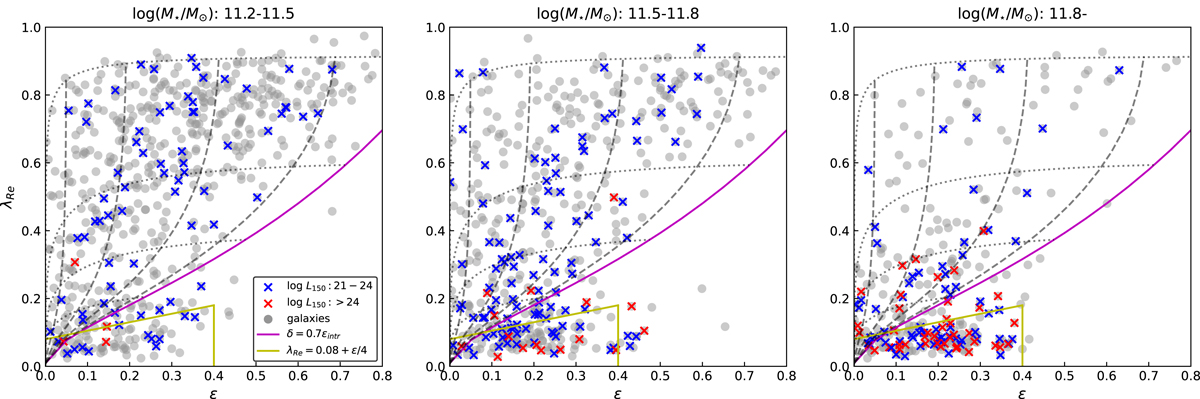
Fig. 3.
Download original image
Distributions of galaxies and radio AGN in the ϵ-λRe plane. From left to right, the three panels show the distributions of galaxies in three M⋆ bins: log(M⋆/M⊙) = 11.2 − 11.5, 11.5 − 1.8, and > 11.8. The total number of AGNs and galaxies within these M⋆ ranges are 302 and 1329, respectively. The source number in each M⋆ bin is listed in Table 1. The blue and red crosses mark the radio AGNs with log(L150 MHz) = 21 − 24 and > 24, and the grey points denote the galaxies within the corresponding M⋆ bin. The yellow lines denote the separation of SRs and FRs proposed by Cappellari (2016). The magenta line shows the estimated λRe of edge-on FR galaxies with maximum anisotropy δ = 0.7ϵintr described in Cappellari et al. (2007), where ϵintri denotes the intrinsic ellipticity. The grey dashed and dotted lines show the λRe for FRs with different inclinations and ϵintr, respectively.
Current usage metrics show cumulative count of Article Views (full-text article views including HTML views, PDF and ePub downloads, according to the available data) and Abstracts Views on Vision4Press platform.
Data correspond to usage on the plateform after 2015. The current usage metrics is available 48-96 hours after online publication and is updated daily on week days.
Initial download of the metrics may take a while.