Fig. 2.
Download original image
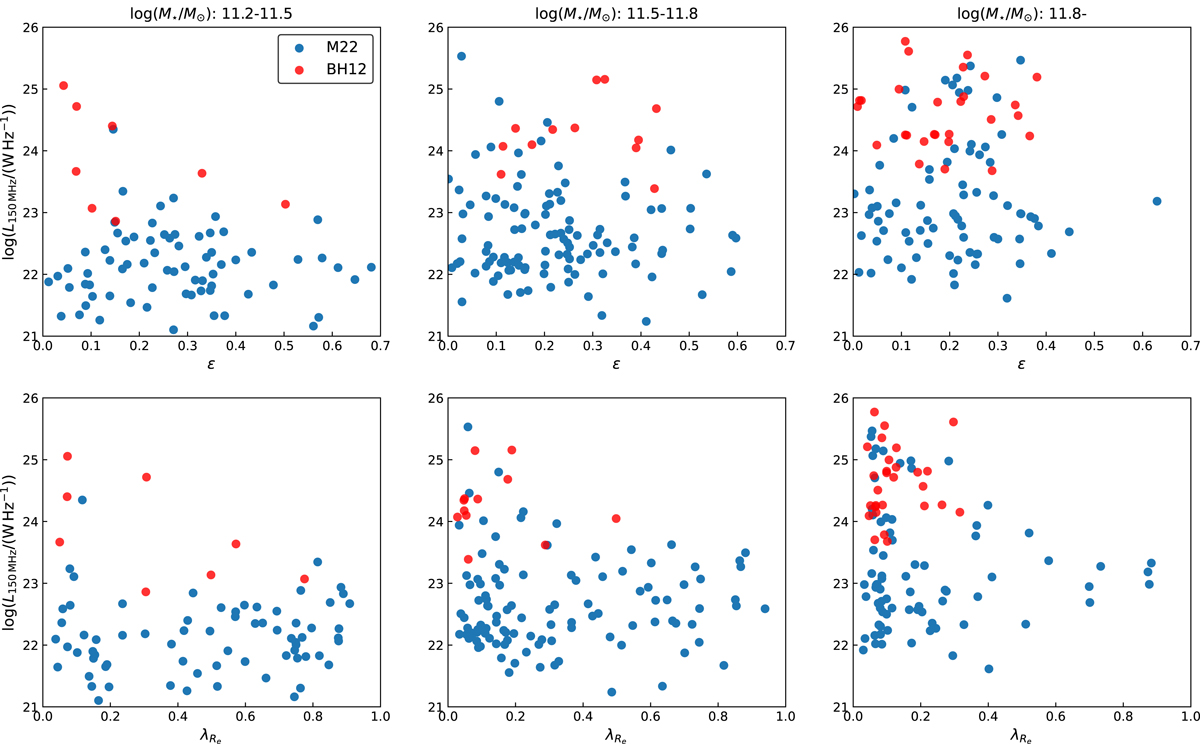
L150 MHz of radio AGNs versus the ϵ and λRe of their host galaxies. The top panels show the L150 MHz of radio AGNs as a function of the ϵ of the host galaxies in three M⋆ bins (from left to right): log(M⋆/M⊙) = 11.2 − 11.5, 11.5 − 1.8, and > 11.8. The bottom panels show the L150 MHz as a function of the λRe of the host galaxies in three M⋆ bins. In all panels, the blue points denote radio AGNs from M22, and the red points denote radio AGNs from the BH12 sample.
Current usage metrics show cumulative count of Article Views (full-text article views including HTML views, PDF and ePub downloads, according to the available data) and Abstracts Views on Vision4Press platform.
Data correspond to usage on the plateform after 2015. The current usage metrics is available 48-96 hours after online publication and is updated daily on week days.
Initial download of the metrics may take a while.