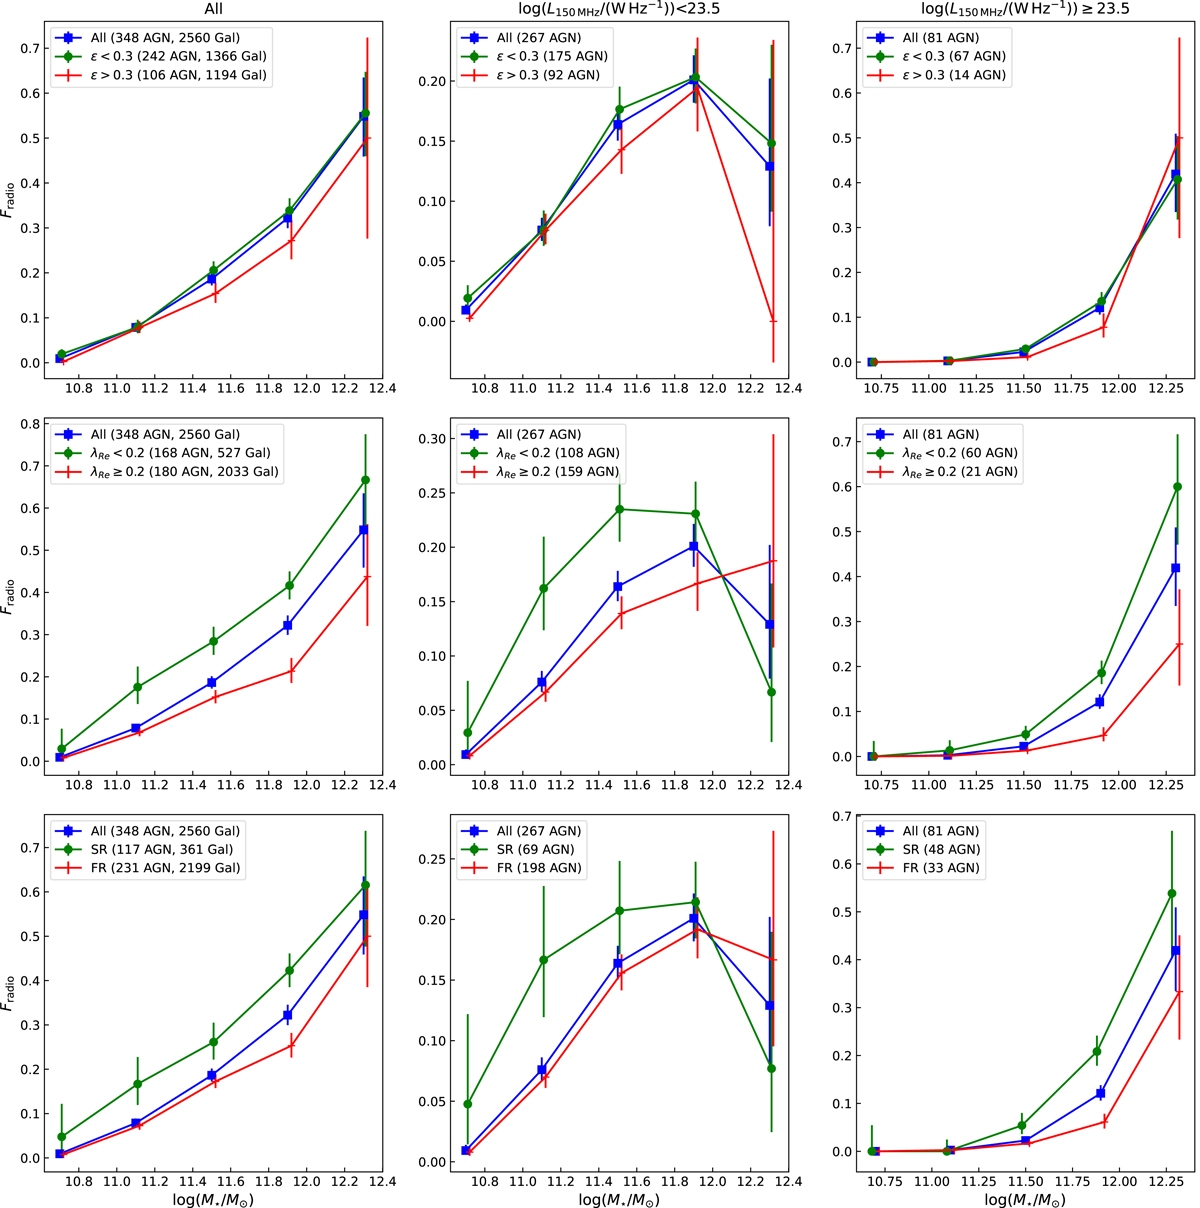
Fig. 4.
Download original image
Fradio-M⋆ relations in different galaxies. From left to right, the three panels in each row show the Fradio for all radio AGNs, radio AGNs with L150 MHz < 1023.5 W Hz−1, and radio AGNs with L150 MHz ≥ 1023.5 W Hz−1. Top row: Fradio-M⋆ relations for galaxies with different ϵ. The blue squares denote the Fradio for all galaxies, and the green points and red dots denote the Fradio for galaxies with ϵ < 0.3 and ϵ > 0.3, respectively. The three lines were shifted a bit horizontally for clarity. Middle row: Fradio-M⋆ relations for galaxies with different λRe. The blue squares denote the Fradio for all galaxies, and the green points and red dots denote the Fradio for galaxies with λRe < 0.2 and λRe > 0.2, respectively. Bottom row: Fradio-M⋆ relations for galaxies with different rotator types. The blue squares denote the Fradio for all galaxies, and the green points and red dots denote the Fradio for SRs and FRs, respectively. The number of AGNs used in each Fradio relation is listed in the corresponding panel. The number of galaxies used in the Fradio calculations is listed in the left panel of each row, and the Fradio in the middle and right panels was calculated based on the same galaxy sample as in the left panels. All error bars are the 1σ Agresti-Coull confidence limits (Agresti & Coull 1998).
Current usage metrics show cumulative count of Article Views (full-text article views including HTML views, PDF and ePub downloads, according to the available data) and Abstracts Views on Vision4Press platform.
Data correspond to usage on the plateform after 2015. The current usage metrics is available 48-96 hours after online publication and is updated daily on week days.
Initial download of the metrics may take a while.