Fig. 3
Download original image
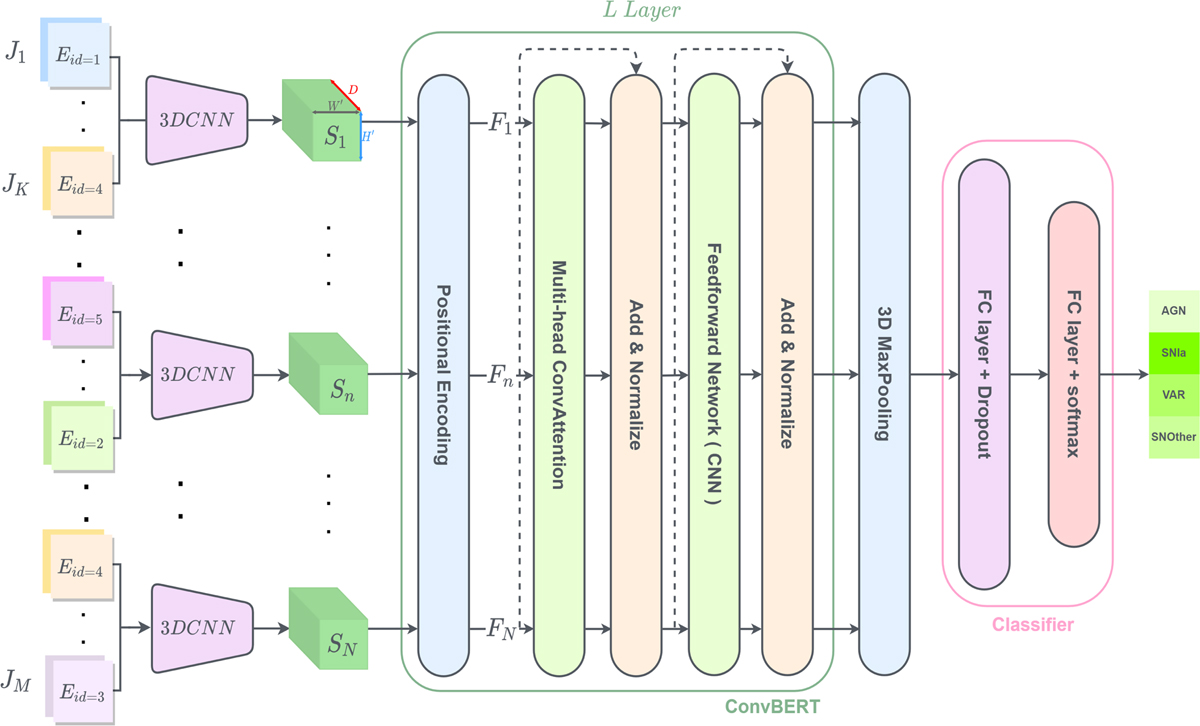
General architecture of the ConvEntion network. The image time series are first rearranged to embed the band information. Then each 3DCNN is fed with a sub-sequence of K inputs of the time series J(∊ ℝM×H×W×2 for M elements of images of size HxW) to create the new downsized sequence S (∊ ℝN×H′×W′×D). S is fed to the positional encoder in order to add the information about the position, which outputs F(∊ ℝN×H′×W′×D). Then F is passed to ConvBERT which has L layers. The 3D max-pooling is used to downsize the output of ConvBERT for the classifier.
Current usage metrics show cumulative count of Article Views (full-text article views including HTML views, PDF and ePub downloads, according to the available data) and Abstracts Views on Vision4Press platform.
Data correspond to usage on the plateform after 2015. The current usage metrics is available 48-96 hours after online publication and is updated daily on week days.
Initial download of the metrics may take a while.