Fig. 8
Download original image
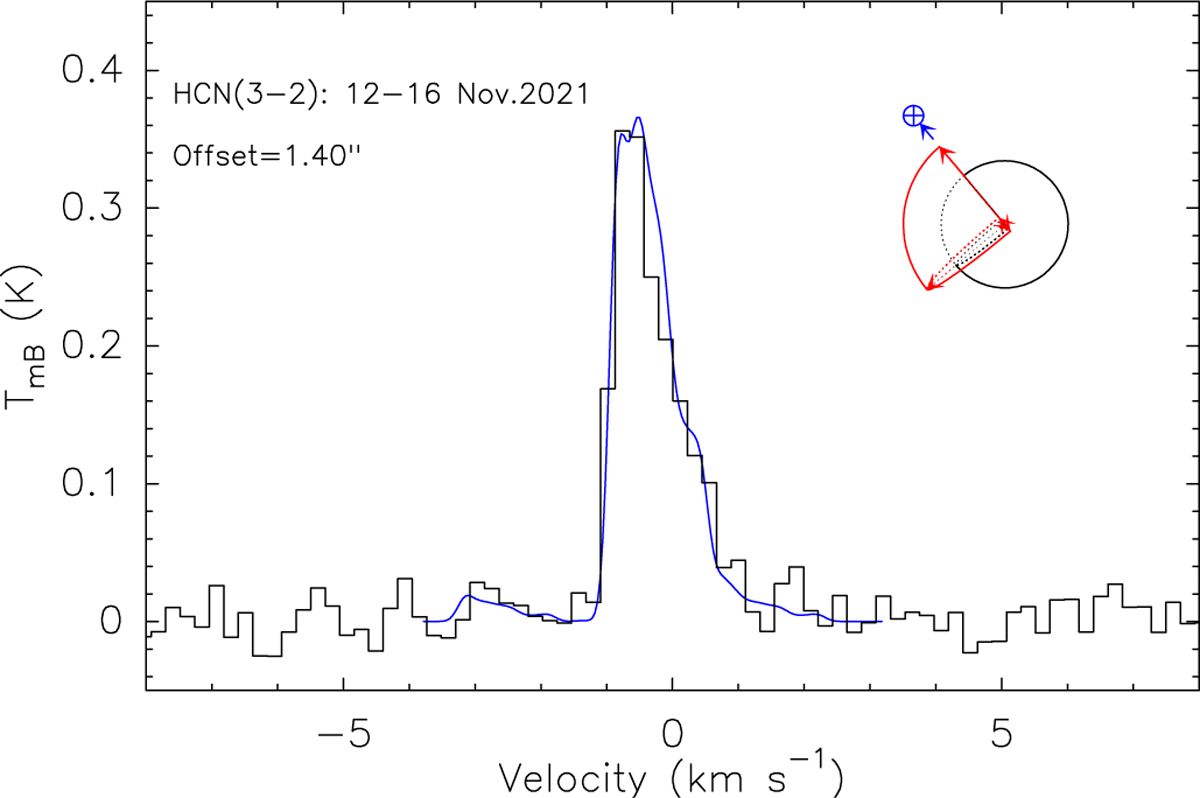
HCN(3−2) line profile (average of 12.1 to 16.2 November 2021) with a simulation superimposed in blue. The vertical axis is the main beam brightness temperature in kelvins, and the horizontal axis is the Doppler velocity in the rest frame of the comet. The inset to the upper right depicts the outgassing pattern used to model the line: QHCN = 0.9 × 1025 molec s−1 in a π sr (half of the hemisphere on the Earth side) jet at 0.86 km s−1 and QHCN = 0.2 × 1025 molec s−1 at 0.54 km s−1 in the remaining 3π sr.
Current usage metrics show cumulative count of Article Views (full-text article views including HTML views, PDF and ePub downloads, according to the available data) and Abstracts Views on Vision4Press platform.
Data correspond to usage on the plateform after 2015. The current usage metrics is available 48-96 hours after online publication and is updated daily on week days.
Initial download of the metrics may take a while.