| Issue |
A&A
Volume 651, July 2021
|
|
|---|---|---|
| Article Number | A25 | |
| Number of page(s) | 15 | |
| Section | Planets and planetary systems | |
| DOI | https://doi.org/10.1051/0004-6361/202140765 | |
| Published online | 06 July 2021 | |
Molecular composition of short-period comets from millimetre-wave spectroscopy: 21P/Giacobini-Zinner, 38P/Stephan-Oterma, 41P/Tuttle-Giacobini-Kresák, and 64P/Swift-Gehrels★,★★
1
LESIA, Observatoire de Paris, PSL Research University, CNRS, Sorbonne Université, Université de Paris,
5 place Jules Janssen,
92195
Meudon,
France
e-mail: This email address is being protected from spambots. You need JavaScript enabled to view it.
2
Jet Propulsion Laboratory, California Institute of Technology,
4800 Oak Grove Drive,
Pasadena,
CA
91109,
USA
3
Laboratoire d’astrophysique de Bordeaux, Université de Bordeaux, CNRS,
B18N, allée Geoffroy Saint-Hilaire,
33615
Pessac,
France
4
IRAM,
300 rue de la Piscine,
38406
Saint Martin d’Hères,
France
5
Johns Hopkins University Applied Physics Laboratory,
11100 Johns Hopkins Rd.,
Laurel,
MD
20723,
USA
6
Solar System Exploration Division, Astrochemistry Laboratory Code 691, NASA-GSFC,
Greenbelt,
MD
20771,
USA
7
Department of Physics, Catholic University of America,
Washington,
DC
20064,
USA
8
Department of Physics, American University,
Washington,
DC,
USA
9
Solar System Exploration Division, Planetary Systems Laboratory Code 693, NASA-GSFC,
Greenbelt,
MD
20771,
USA
10
UK Astronomy Technology Centre, Royal Observatory,
Edinburgh,
UK
11
Koyoma Astronomical Observatory, Kyoto Sangyo University Motoyama,
Kamingamo, Kita-ku,
Kyoto
603-8555,
Japan
Received:
9
March
2021
Accepted:
17
May
2021
Abstract
We present the results of millimetre-wave spectroscopic observations and spectral surveys of the following short-period comets: 21P/Giacobini-Zinner in September 2018, 41P/Tuttle-Giacobini-Kresák in April 2017, and 64P/Swift-Gehrels and 38P/Stephan-Oterma in December 2018, carried out with the Institut de RadioAstronomie Millimétrique (IRAM) 30-m radio telescope at wavelengths between 1 and 3 mm. Comet 21P was also observed in November 1998 with the IRAM 30-m, James Clerk Maxwell Telescope, and the Caltech submillimeter Observatory radio telescopes at wavelengths from 0.8 to 3 mm. The abundances of the following molecules have been determined in those comets: HCN, CH3OH, CS, H2CO, CH3CN, and H2S in comet 21P; HCN and CH3OH in 41P; HCN, CH3OH, and CS in 64P; and CH3OH in 38P. The last three comets, classified as carbon-chain typical from visible spectro-photometry, are relatively rich in methanol (3.5–5% relative to water). On the other hand, comet 21P, classified as carbon-chain depleted, shows abundances relative to water which are low for methanol (1.7%), very low for H2S (0.1%), and also relatively low for H2CO (0.16%) and CO (<2.5%). Observations of comet 21P do not show any change in activity and composition between the 1998 and 2018 perihelions. Sensitive upper limits on the abundances of other molecules such as CO, HNCO, HNC, or SO are also reported for these comets.
Key words: comets: general / comets: individual: 21P/Giacobini-Zinner / radio lines: planetary systems / submillimeter: planetary systems
The radio spectra are only available at the CDS via anonymous ftp to cdsarc.u-strasbg.fr (130.79.128.5) or via http://cdsarc.u-strasbg.fr/viz-bin/cat/J/A+A/651/A25
Based on observations carried out with the IRAM 30-m telescope. IRAM is supported by INSU/CNRS (France), MPG (Germany) and IGN (Spain).
© N. Biver et al. 2021
 Open Access article, published by EDP Sciences, under the terms of the Creative Commons Attribution License (https://creativecommons.org/licenses/by/4.0), which permits unrestricted use, distribution, and reproduction in any medium, provided the original work is properly cited.
1 Introduction
Comets are the most pristine remnants of the formation of the Solar System 4.6 billion years ago. They sample some of the oldest and most primitive material in the Solar System, including ices, and they are thus our best window into the volatile composition of the proto-solar disk. Comets may have also played a role in the delivery of water and organic material to the early Earth (see Hartogh et al. 2011, and references therein). The latest simulations of early Solar System evolution (Brasser & Morbidelli 2013; O’Brien et al. 2014) suggest a more complex scenario. On the one hand, ice-rich bodies that formed beyond Jupiter may have been implanted in the outer asteroid belt and participated in the supply of water to Earth or, on the other hand, current comets coming from either the Oort Cloud or the scattered disk of the Kuiper belt may have formed in the same trans-Neptunian region, sampling the same diversity of formation conditions. Understanding the diversity in the chemical and isotopic composition of cometary material is thus essential in order to assess such scenarios (Altwegg & Bockelée-Morvan 2003; Bockelée-Morvan et al. 2015).
Comet 21P/Giacobini-Zinner is a Jupiter-family comet (JFC) orbiting the Sun every 6.5 yr on a moderately low-inclination (32.0°) orbit. It was first discovered by M. Giacobini in 1900 and rediscovered by E. Zinner in 1913. It has since been observed at 14 out of 16 perihelion passages. Its perihelion distance oscillates in the 0.93–1.10 au range during the 20th and 21st century with best apparitions when perihelion happens in September or October. The 2018 perihelion passage was the most favourable one since 1959 and until 2078, with a minimum geocentric distance (Δ) of 0.392 au (the peak visual magnitude was 7.0). This latest apparition was somewhat similar to the 1985 one, when the ICE spacecraft flew by the comet nucleus at a distance of 7800 km (Cowley 1985). In 1998, the shortest distance from Earth was 0.850 au (the peak visual magnitude was 8.5). The next relatively favourable apparition will be in September 2031 (Δ = 0.55 au). The orbit ofcomet 21P crosses Earth’s orbit and it is well known as being the parent of the Draconids meteor shower, which reached storm levels in 1933 and 1946.
Comet 41P/Tuttle-Giacobini-Kresák is a JFC orbiting the Sun every 5.4 yr with a low inclination (9°) orbit. It was first discovered by Horace Tuttle in 1858. The comet was observed by Michel Giacobini in 1907, but the link between the two apparitions was not established until 1928. Nevertheless, the comet was not recovered until 1951 by Lubor Kresák when its periodic nature was secured. 41P is a weakly active comet (radius < 1 km, Lamy et al. 2004)and it has been mostly observed only during its favourable apparitions. Comet 41P is also well known for its frequent and dramatic outbursts: It displayed surges of brightness over a period of a few days, of 10 magnitudes amplitude twice in 1973, 1 magnitude in 1995, and 4–5 magnitudes twice in 2001. The 2017 return was the most favourable apparition in three centuries. The perihelion (1.05 au) lies just outside Earth’s orbit. The minimum geocentric distance was 0.142 au on 1 April 2017 when the comet reached a peak magnitude of 6.5. Optical observations in 2017 reported a dramatic change and slow-down of its rotation speed with a period increasing from 20 h to 46 h (Bodewits et al. 2018) or from 24 h to 48 h according to Schleicher et al. (2018) in only 1–1.5 months around perihelion. This suggests that the previous outbursts may have been associated with partial rotational break-up.
Comet 64P/Swift-Gehrels is a JFC orbiting the Sun every 9.4 yr on a low-inclination (8.9°) orbit. It wasfirst discovered by L. Swift in 1889, rediscovered by T. Gehrels in 1973 and observed during each perihelion passage since. The most recent apparition perihelion was on 3.9 November 2018 UT at 1.393 au from the Sun. It made its closest approach ever to the Earth on 28 October 2018 at 0.445 au which provided one of the best opportunities for studying this comet remotely (peak magnitude of 9).
Comet 38P/Stephan-Oterma is classified as a Halley-type comet orbiting the Sun every 38 yr, but on a relatively low-inclination orbit (18°). Comet 38P was also first discovered in the 19th century (by E.J.M. Stephan but also J.E. Coggia and E.W.L. Tempel, in January 1867) and rediscovered in 1942 by L. Oterma, after one missed perihelion passage. The perihelion passage of 11 November 2018 at 1.589 au from the Sun was similarly favourable to the previous observed ones, with a perigee of 0.768 au on 17 December 2018 (peak magnitude of 9.5).
Comet 21P was the target of dedicated observing programmes with the Institut de RadioAstronomie Millimétrique (IRAM) 30-m telescope in November 1998 (perihelion on 21.3 November 1998 at 1.033 au from the Sun) and September 2018 (perihelion on 10.3 September 2018 at 1.013 au). It was also observed with the 15-m James Clerk Maxwell Telescope (JCMT) and the 10.4-m Caltech submillimeter Observatory (CSO) in November 1998. An international observing campaign was also set up for comet 41P and we observed it with the IRAM 30-m after perihelion (observations before perihelion suffered from bad weather). We observed comets 64P and 38P with the IRAM 30-m telescope at a time when the main target (comet 46P/Wirtanen) was unavailable on 12, 13, and 18 December 2018 UT. We searched for several molecules in those comets. We report the detections of HCN, CH3 OH, CS, CH3 CN, and H2 CO and tentatively H2 S in 21P; HCN and CH3 OH in 41P; HCN, CH3 OH, and CS in 64P; and a tentative detection of CH3OH in 38P. Sections 2 and 3 present the observations and frequency coverage. Section 4 shows the spectra of the detected molecules. Section 5 presents the information extracted from the observations for analysis and so as to compute production rates. Section 6 provides the retrieved production rates and abundances or upper limits, which are discussed and compared to other comets in Sect. 7.
2 Observations with the IRAM 30-m telescope
Comet 21P was observed under good to fair weather conditions (2 to 5 mm of precipitable water vapour – pwv) daily during the 11–15 November 1998 period. In 2018, during the 14–18 September allocated period, the weather was very poor, with high opacity (9–40 mm of pwv, most of the time between 10 and 16 mm). The observations were thus more concentrated on the low frequency bands of the EMIR receiver (2 and 3 mm bands, Carter et al. 2012). The comet was tracked using orbital elements JPL#K182/71 in 2018, where ~ 4′′ ephemeris error was estimated afterwards.
Comet 41P observations were originally planned during two sessions, mid-March and at the end of April 2017, to observe its evolution from before to after perihelion. However, adverse weather conditions limited observations to only two nights (out of the eight scheduled) post perihelion on 26.0 April and 1.0 May 2017 UT, with average weather (3–6 mm pwv). 41P was tracked using the JPL#171/7 orbit solution. The difference in ephemeris computed with the JPL#171/18 solution of 2018 and those used by the IRAM new control system (NCS software) was negligible (< 0.2′′). A map of HCN(3–2) taken on 26 April yielded a final pointing error of less than 2′′.
Comets 64P and 38P were observed under good weather conditions (~ 2 mm of precipitable water vapour) on 11.8 and 17.9 December 2018, to fair weather (pwv ~5 mm) for 38P on 12.1 and 13.1 December 2018 UT. 64P was tracked using the JPL#183/4 orbit solution (JPL#35 for 38P) to compute the position in real time. Pointing was regularly checked on bright sources (rms <1′′) but ephemeris errors around 2′′ both in RA and Dec were found afterwards. The two comets were observed for a short time on three different days with different frequency coverage (Table 1).
In 1998 we used 3 mm, 2 mm, and 1 mm ‘B100’, ‘C150’, and ‘B230’ newly installed single-side band (SSB) receivers in parallel, each with a maximum 512 MHz bandwidth, connected to filter banks and correlators. In 2017–2018, we used the EMIR (Carter et al. 2012) 3 mm, 2 mm, and 1 mm band receivers in 2SB mode which offer two instantaneous bandwidths of 8 GHz per polarisation. They were connected to the Fourier Transform Spectrometer (FTS) which covers the full bandwidths with 0.195 MHz sampling (corresponding to 0.22–0.24 km s−1 at 1 mm wavelength). The central part of the band was also connected to the VESPA autocorrelator. Some lines (e.g. CH3OH(52 − 41)E at 266 838.123 MHz, HCN(1–0) at 88 631.848 MHz) were also observed with VESPA using its higher spectral resolution (e.g. 20–40 kHz sampling) in a narrow bandwidth (20–80 MHz).
In order to cancel the sky emission, a wobbler switching mode at a frequency of 0.5 Hz was used for most observations, with reference sky positions at ± 180′′ in azimuth. In 1998 some observations were obtained in frequency switching mode with frequency throws of 7.2, 7.8, or 15.85 MHz.
Log of millimetre observations.
3 Observations with JCMT and CSO
Comet 21P was also observed from Maunakea between 30 October and 14 November 1998. The weather was good on 30, 31 October,1, 2, 3, and 14 November 1998 with less than 1 mm pwv, average on 4 and 15 November (2 mm pwv) and poor for Maunakea standards on 10 and 13 November (about 5 mm pwv). With the exception of some observationsof the HCN(3–2) line at 265.9 GHz, most of these observations used the 0.8 mm band receivers (304–363 GHz). Some of the JCMT observations were obtained in the slow frequency switching mode, switching by ± 8.1 MHz every two seconds. Other observations were obtained by beam switching with a reference at 2′ in azimuth. AllCSO observations and some of the JCMT observations were obtained in double-side band (DSB) mode with the two side bands separated by 3 GHz and overlapping in the resulting spectrum. Additional information is provided in Table 1. The tracking of the comet was done by interpolating ephemeris generated with the JPL-DE406#27 orbit solution.
4 Spectra and line intensities
Some of the spectra of 21P obtained in the frequency switching mode at JCMT or IRAM in 1998 are contaminated by stratospheric HCN, H2 CO, or mesospheric CO. The telluric line however falls at an absolute frequency different from the comet line thanks to its Doppler shift. However the wings of the broader stratospheric lines overlap with the comet spectra and we had to remove a fit to the atmospheric line to obtain a flatter baseline in the figures presented here and to derive accurate noise and line intensities. Three lines of HCN, seven lines of CH3OH, and one each of CS and H2CO were detected with the JCMT, CSO, and IRAM telescopes in 1998. Spectra (average of several days of observations in some cases) are shown in Figs. 1, 2, 3, and 4. The daily intensities of the lines observed with JCMT and CSO are provided in Tables A.1 and A.2, respectively. The intensities of the lines observed with the IRAM 30-m telescope in 1998 and 2018 are provided in Table A.3. The mean Doppler shift of each line is computed as the first moment integral over the line width (∫ Tb.v.dv∕∫ Tb.dv), excluding the weaker (<4%) hyperfine components for HCN, and taking the average on the two strongest hyperfine components for HCN(1–0). In 2018, lines were stronger because the comet was closer to Earth. The EMIR receivers at the IRAM 30-m telescope are also more sensitive than the receivers used in 1998, and offer a much broader bandwidth (Table 1). Spectra are shown in Figs. 5, 6, and 7.
Spectra of HCN and CH3OH detected in comet 41P are shown in Figs. 8 and 9 and integrated intensities are provided in Table A.4.
For comet 64P, the HCN(3–2) was clearly detected on 11.8 December (Fig. 10) together with a marginal detection of methanol lines at 266.838 GHz and around 252 GHz. CH3OH was best detected via its 242 GHz lines (Fig. 11) on 17.9 December UT. CS(5–4) was marginally seen in this same observation. Integrated intensities or 3 − σ upper limitsare provided in Table A.5. No individual line was clearly detected in comet 38P/Stephan-Oterma, owing to very limited integration times.
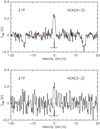 |
Fig. 1 Lines observed with the JCMT 15-m in comet 21P: HCN(4–3) at 354 505.472 MHz between 30 October and 2 November 1998, and HCN(3–2) at 265 886.434 MHz on 4.2 November 1998 UT. Negative ‘ghost’ lines appear at ± 13.7 km s−1 (16.2 MHz) in the HCN(4–3) spectrum owing to the frequency switching technique. The position and relative intensity of the hyper-fine components are drawn below the spectra. The vertical scale is the main beam brightness temperature and the horizontal scale is the Doppler velocity in the comet rest frame. |
5 Data analysis
In order to derive production rates, we assume steady-state outgassing at a constant velocity and use the Haser density profile. Excitation of the molecular rotational lines depends on radiative and collisional processes. Collisions with neutrals and electrons are taken into account but depend on the gas temperature and water production rate. Model parameters are given in Table 3.
5.1 Expansion velocity and outgassing pattern
The expansion velocity is derived from the lines observed with the best signal-to-noise ratio (S/N). Generally the Doppler velocity at half maximum intensity (VHM) in the comet frame provides a good estimate of the expansion velocity: on the observer side from negative velocities and on the opposite side (gas moving away seen on the redshifted side of the line). When possible for a double-peak line we fitted two Gaussians from which we measure the two V HMs. We took the average value of the expansion velocity deduced from the blueshifted and redshifted sides of the lines.
For 21P average values are given in Table 3 for the various periods. The lines do not show a strong asymmetry (Figs. 1–7, especially looking at the very symmetric HCN(1–0) line observed with high frequency resolution in 2018 in Fig. 7). The Doppler shift is small or not significant (Table A.1–A.3, Col. 7). Therefore we assumed symmetric outgassing at a mean velocity of 0.7 to 0.73 km s−1 for 21P.
The expansion velocity we assumed for comet 41P was derived from the profile of HCN(3–2) (Fig. 8) and the CH3OH (20 − 1−1)E and (52 − 4−1)E lines, which were observed with the high-resolution backend VESPA. The hyperfine structure of the HCN(3–2) line has a minor effect on the broadening of the main component and was taken into account to derive the expansion velocity. From their line shape, we obtained the average values VHM = −0.8 and +0.6 km s−1, and consequently we assumed a mean expansion velocity of 0.7 km s−1.
For comet 64P, from the profile of the spectra of HCN(3–2) and CH3OH(50 − 40)A at 241 791.367 MHz which have the highest S∕N (10 and 6, respectively) we determined a gas velocity of 0.80 ± 0.05 km s−1 on the Earth-facing side, and 0.5 ± 0.1 km s−1 on the other side. Since the phase angle (Table 1) was small (less than 28°), in contrary to the two previous comets, the Earth-facing side was close to the day side and line asymmetry can be associated with day-to-night asymmetry in activity. We adopted the mean value vexp = 0.65 km s−1. The mean Doppler shift of the lines (Table A.5, Col. 7) was also significantly negative, confirming the preferential outgassing on the day side at a higher velocity.
For comet 38P, which was observed at 1.6 au from the Sun, we assumed vexp = 0.6 km s−1, using the general  -dependence of the expansion velocity observed in comets (Biver et al. 2000, 2006).
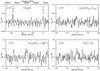 |
Fig. 2 Lines observed with the JCMT 15-m in comet 21P: two CH3OH lines at 338 GHz on 31.3 October and one line at 350 905.100 MHz on 4.3 November 1998 UT (left side); H2 CO at 351 768.639 MHz on 3.2 November and CS at 342 882.850 MHz on 1.3 November 1998 UT (right side). The vertical scale is the main beam brightness temperature and the horizontal scale is the Doppler velocity in the comet rest frame. The frequency scale for the CH3 OH lines at 338 GHz is also provided on the upper axis. |
5.2 Gas temperature
Rotational temperatures were measured for methanol and CH3CN. In some cases a meaningful rotational temperature of HCN could also be deduced from contemporaneous observation of HCN(1–0) with IRAM 30-m and HCN(3–2) with CSO 10.4-m, which probed the same region of the coma (same beam size of ~ 26′′). Nevertheless the rotational temperature is not necessarily a measurement of the gas temperature Tgas of the inner coma. As radio observations often sample a region larger than the collision-dominated region of the coma, the population of the rotational levels of the considered molecule evolves radiatively throughout the beam owing to spontaneous decay and infraredpumping via vibrational bands. Some series of methanol lines around 165, 157, 252, or 305 GHz sample rotational levels from the same K-ladder that evolve in a similar manner and keep memory of the thermal equilibrium in the collision-dominated region (Bockelée-Morvan et al. 1994). On the other hand, the rotational levels sampled by methanol lines around 145, 242, or 338 GHz, as well as HCN, are more sensitive to the collision rate and evolve rapidly towards a much colder fluorescence equilibrium. Consequently, their average rotational temperature in the beam is much lower than Tgas. Measured values of Trot and constraints derived on the gas temperature Tgas are provided in Table 2.
Several methanol lines were detected in 1998 and in 2018 in comet 21P. In 1998, however, the constraints remain loose on the gas temperature owing to low S/N (Table 2). We adopted a value of Tgas = 40 K. In 2018 the rotational temperature of the methanol lines at 145 and 165 GHz (Fig. 12) could be more precisely measured and we adopted Tgas = 42 K.
For comet 41P, the individual methanol lines were often only marginally detected (Table A.4), so the uncertainty in the rotational temperature is relatively large:  K, Trot = 28 ± 7 K, and
  K for the 165, 252, and 242 GHz lines respectively. The rotational temperature of the 165 and 252 GHz lines are expected to provide a good estimate of Tgas, whereas we expect a lower value for the 242 GHz lines. Hence, we used Tgas = 45 K, but also tested a value of 35 K, which yields similar production rates (3–8% lower for both HCN and CH3OH).
We had only weak constraints on the gas temperature from the observations of methanol lines in 64P. The rotational temperature of the lines around 252 GHz is  K, which suggests a gas temperature Tgas in the 33–100 K range. The rotational temperature of the 242 GHz lines is better constrained (Fig. 13) with Trot = 18 ± 5 K. Unfortunately it does not bring a precise constraint on the gas temperature: for the assumed collision rate, this rotational temperature is compatible with any value of Tgas in the 10–100 K range. We adopted T = 40 K, consistent with the values measured in comets of similar activity and heliocentric distance. In any case, a change of ± 10 K does not result in a change of production rate larger than the uncertainties owing to the limited signal-to-noise of the dataset, and much larger changes in temperature have never been seen in comets of similar activity. We assumed a lower temperature Tgas = 30 K for comet 38P, typical for comets of moderate activity observed at 1.6 au from the Sun (e.g. Biver et al. 2012).
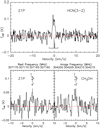 |
Fig. 3 Lines observed with the CSO 10.4-m in comet 21P: HCN(3–2) at 265 886.434 MHz on 10–14 November 1998 UT, and CH3OH lines at 307 165.911 MHz (Upper Side Band, left upper axis scale) and 304 208.324 MHz (Image and Lower Side Band, right upper axis scale) on 14.3 November 1998 UT. The receiver tuning was adjusted in order to get those two methanol line in the same spectrum separated by 20 MHz. The vertical scale is the main beam brightness temperature and the horizontal scale is the Doppler velocity in the comet rest frame. The frequency range of 40.7 MHz for the CH3 OH spectrum corresponds to a 40 km s−1 Doppler velocity window as for HCN. A velocity scale centred on each line has been plotted on the lower axis of the methanol spectrum. |
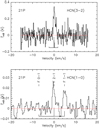 |
Fig. 4 HCN(3–2) line in comet 21P observed with the IRAM 30-m on 11.7–14.7 October 1998 and HCN(1–0) observed on 11.7–15.7 October 1998. Scales as in Fig. 1. |
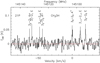 |
Fig. 5 CH3OH lines at 145 GHz in comet 21P observed with the IRAM 30-m on 14.2–17.2 September 2018 UT. The vertical scale is the main beam brightness temperature and the horizontal scale is the Doppler velocity in the comet rest frame and the rest frequency in MHz is provided on the upper axis. |
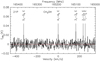 |
Fig. 6 CH3OH lines at 165 GHz in comet 21P observed with the IRAM 30-m on 16.1–18.2 September 2018 UT. Scales as in Fig. 5. |
5.3 Reference water production rate
OH was observed in comet 21P with the Nançay radio telescope in 1985 (Gérard et al. 1988), 1998 and 2018. The 1998 data provided OH production rates in the range 3–4 × 1028 molec. s−1 for the period of the millimetre observations (Crovisier et al. 2002), whereas Combi et al. (2011) provided slightly higher production rates, with a value around 5 × 1028 molec. s−1 at perihelion (21 November 1998). In 2018, no reliable OH production rate could be derived from Nançay data during the IRAM observations because of the poor OH maser inversion at that time. Combi et al. (2011) also showed a trend observed at each perihelion passage of comet 21P: the activity peaks about 25 days prior to perihelion, with a steep decrease afterwards. This was also observed for the visual heliocentric magnitude, which peaked 1–2 weeks prior to perihelion in 1998 and 2018. In 2018, Roth et al. (2020) observed OH and H2 O in the infrared yielding a water production rate in the range 3.2–3.0 × 1028 molec. s−1 for the 7–11 September period, just before our IRAM observations. Faggi et al. (2019), also from infrared observations of H2 O, found water production rate in the range 2.6–2.8 × 1028 molec. s−1 for the 8 September–7 October 2018 period. We thus assumed 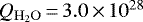 molec. s−1 at the time of IRAM observations (Table 3).
Comet 41P outgassing was monitored by several observatories during its 2017 approach, including the Solar Wind ANistropies (SWAN) instrument on the SOHO spacecraft (31 March to 20 April, Combi et al. 2019), TRAPPIST (11 March to 24 May for OH, Moulane et al. 2018) and with the Nançay radio telescope (4 March–5 June). The comet was not observed at Nançay at the time of the IRAM observations because of poor OH inversion. OH production rates of ≈ 1.1 × 1028 and 0.6 × 1028 molec. s−1 were obtained for the 28 March–3 April and 18–30 May, respectively. Most of the observations showed a plateau of activity ±20 days around perihelion with  4, 3 and 8 × 1027 molec. s−1 respectively. We adopted a median value of
 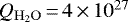 molec. s−1 for the time of our observations.
For comets 64P and 38P, around the time of our observations, water production rates were estimated from ground-based spectro-photometric observations of OH. D.G. Schleicher (priv. comm.) provided  molec. s−1 for 64P on 16 December 2018. For comet 38P his values were
  molec. s−1 on 3 and 16 December 2018. We adopted water production rates of
  molec. s−1 for 64P and
  molec. s−1 for 38P, both to compute collision rates and determine molecular abundances. 64P and 38P were only observed in September and October at Nançay.
6 Production rates and abundances
Line intensities have been converted to production rates using our time-dependent non-LTE code taking into account collisions with neutrals and electrons as well as solar radiative pumping via vibrational bands for HCN, CH3OH, CS, H2 CO, CO, and CH3CN, as used in previous papers (Biver et al. 2000, 2006, 2012, 2014, 2015, 2016). Photolysis constants are also from previous papers and detailed in Biver et al. (2021). Production rates or upper limits are provided in Table 4. For species with multiple lines observed at the same time, the weighted average is provided.
6.1 Relative abundances
Abundances relative to water were computed using the average water production rates provided in Table 3. For 41P we assumed a lower water production rate (0.3 × 1028 molec. s−1) for the second day (1.0 May 2017) because HCN and CH3OH showed a significant decrease in production rate and Moulane et al. (2018) also found a decrease in the water production rate between 26.1 April and the 28 April–3 May period. For 38P, abundances relative to water assume  molec. s−1. Although no line is detected with a signal-to-noise larger than 2, the combined signal of the 13 strongest methanol lines at 165–170 GHz and 242 GHz yields a formal signal-to-noise of 3.5 and a realistic methanol abundance of 5.0 ± 1.4%. For comet 21P we took the average of 1998 and 2018 measurements as they do not show any difference.
Abundances and a comparison to values measured in other comets are provided in Table 5. Range of abundances measured in the full sample of comets and in other JFCs in the radio is also provided in the last two columns (Biver & Bockelée-Morvan 2019; Biver et al. 2021).
6.2 Evolution of production rates of comet 21P
Comet 21P was observed during a two-week period in 1998 and again in 2018 after three full orbits around the Sun. Figure 14 shows both series of production rates measurements relative to the time of perihelion. The 1998 data show a decreasing trend of the production rates of methanol and HCN over the two weeks. The 4-day span of the 2018 observation is too short to draw definitive conclusions, but shows production rates very similar to the 1998 values. The heliocentric distance in 2018 was on average 4% lower than in 1998. If the peak outgassing follows  , it should have been 8% higher in 2018. Taking this change into account, one can infer that the comet activity follows the same trend as in 1998 of continuous decrease of active surface around perihelion. This was also observed by Combi et al. (2011) and Roth et al. (2020) for the 1998, 2005, and 2018 perihelions. Besides this small trend, production rates and relative abundances were very similar in 1998 and 2018, suggesting no significant secular trend both in activity and composition.
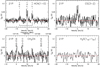 |
Fig. 7 Observations of comet 21P with the IRAM 30-m in 2018: HCN(1–0) on 14.2–17.8 September, CS(3–2) and CH3 CN on 14.2–17.2 September and H2S(110 − 101) on 16.1–18.2 September UT. Scales as in Fig. 1. All the spectra are plotted with the same intensity scale and Doppler velocity range (40 km s−1). The rest frequency in MHz is provided on the upper axis of CH3CN lines. |
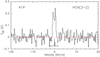 |
Fig. 8 HCN(3–2) line in comet 41P observed with the IRAM 30-m on 26–31 April 2017. Scales as in Fig. 1. |
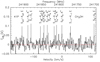 |
Fig. 9 CH3OH lines at 242 GHz in comet 41P observed with the IRAM 30-m on 26.1 April 2017. The vertical scale is the main beam brightness temperature and the horizontal scale is the Doppler velocity in the comet rest frame and the rest frequency in MHz is provided on the upper axis. |
7 Discussion and conclusion
Comet 64P/Swift-Gehrels had its most favourable apparition in 2018 and was poorly investigated at previous perihelion passages. It attracted special attention as it started its pre-perihelion activity in August 2018 with a few outbursts (Kelley et al. 2019). Regarding its composition based on optical spectroscopy, preliminary TRAPPIST (E. Jehin, priv. comm.) values obtained in January 2019 yield log [Q(C2)∕Q(CN)] = −0.02. For comet 38P, the value is + 0.10 (TRAPPIST) to + 0.01 near its previous perihelion passage (A’Hearn et al. 1995). For 41P, log [Q(C2)∕Q(CN)] = 0.06 from Moulane et al. (2018). These three comets are thus classified as ‘typical’ according to the classification by A’Hearn et al. (1995) based on optical spectroscopy. Comet 21P, on the other hand, is classified as carbon-chain depleted with log(Q(C2)/Q(CN)) = −0.67 (A’Hearn et al. 1995). Our millimetre-wave observations suggest that ‘typical’ comets have a higher methanol-to-water abundance ratio (Table 5), which appears to be often correlated with a high C2/OH (and C2/CN for comets studied here).
Comet 21P is severely depleted in H2S; it has the lowest H2S abundance relative to water observed so far, and the same is true for CS. Calmonte et al. (2016) found that the sulphur budget in comet 67P/Churyumov-Gerasimenko led to S/O ~ 1.5% in the volatile phase, with H2S as a major contributor. If the ratio is similar in comet 21P, it implies that sulphur species could represent more than 1% relative to water (assuming CO2/H2O ≤25%, based on e.g. Ootsubo et al. 2012, for the O budget). In most other comets investigated at radio wavelengths(Biver & Bockelée-Morvan 2019) the total of sulphur species amounts to 1–2% relative to water (in number). Unless comet 21P is depleted in sulphur in its volatile phase, one may wonder if OCS, SO(SO2), H2 CS, CH3SH, or some other molecule, could be major sulphur species in its coma. This cannot be completely excluded by the upper limits we obtained (see Tables 4 and 5 for the former species and we don’t have stringent upper limits for the others). However Saki et al. (2020) derived OCS/H2O = 0.11 ± 0.02% in comet 21P.
Besides CH3CN, CS, and HCN, all other molecules (CH3OH, H2 CO, H2 S, CO) show abundances towards the low end observed in comets (Table 5; Bockelée-Morvan & Biver 2017). The relatively low abundance of methanol seen in the radio around perihelion was also derived in the infrared in 1998 (Weaver et al. 1999), 2005 (DiSanti et al. 2013) and 2018 (Faggi et al. 2019), with abundances around 1.3% relative to water.
Comet 21P is also depleted in NH (A’Hearn et al. 1995) and NH2 (Fink 2009) but showed unidentified emission near 8, 9 and 11 μm, some of which could be attributed to complex organics according to Ootsubo et al. (2020). Unfortunately the sensitivity of the 2018 observations was limited and our upper limits on the abundance of complex organics such as NH2CHO or CH3CHO are higher than values measured in comets (Biver et al. 2021), but nevertheless show that comet 21P is not strongly enriched (by a factor >5) in these molecules. The depletion of sulphur species, carbon-chain organics and NH2 might be present in the volatile phase of comet 21P, but compensated by an enrichment in heavier refractory species as suggested by Ootsubo et al. (2020). Its observations at two different perihelion passages, separated by 20 yr, do not show any significant change.
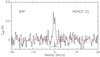 |
Fig. 10 HCN(3–2) line in comet 64P/Swift-Gehrels observed with the IRAM 30-m on 11.8 December 2018. Scales as in Fig. 1. |
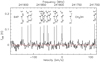 |
Fig. 11 CH3OH lines at 242 GHz in comet 64P/Swift-Gehrels observed with the IRAM 30-m on 17.9 December 2018. Scales as in Fig. 9. |
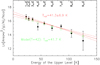 |
Fig. 12 Rotational diagram of the methanol lines at 165 GHz in comet 21P. We plot the logarithm of a quantity which should be proportional to the average upper level population in the beam (for optically thin line, Bockelée-Morvan et al. 1994) against the energy of the upper level, for each transition. At thermal equilibrium at T all points should align on a line of slope 1∕T. The blackdots with errorbars are the observed values, with upper level of the corresponding transition labelled above. The red line shows the best fit to the observations, with dashed lines for the ± 1σ values of the rotational temperature given above the plot. Green circles show the predicted values for a model with a Tgas = 42 K implying a rotational temperature of 41.7 K. |
Rotational and inferred gas temperatures.
Adopted model parameters.
Production rates.
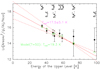 |
Fig. 13 Rotational diagram of the methanol lines at 242 GHz in comet 64P/Swift Gehrels. Scales are as is Fig. 12. The green circles show the predicted values for a model with a gas temperature Tgas = 50 K which implies a lower rotational temperature of 19.5 K. |
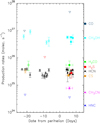 |
Fig. 14 Evolution of the production rates of comet 21P. Empty symbols (left side) are production rates measured in October–November 1998 a few days before perihelion (rh = 1.034 on 21.3 November 1998). Filled symbols correspond to measurements of 2018, shortly after perihelion (rh = 1.013 on 10.3 September 2018). Downward pointing empty triangles are upper limits (for CO in dark blue, H2 S in red and HNC in blue) for the corresponding period. The vertical scale is the production rate in molec. s−1, and the horizontal scale the date of observation relative to the relevant perihelion date. |
Abundance of organic molecules detected in comets.
Acknowledgements
This work is based on observations carried out under projects number 035-98, 086-16, 002-18, 112-18 with the IRAM 30-m telescope and M98BH02 with the JCMT. IRAM is supported by the Institut Nationnal des Sciences de l’Univers (INSU) of the French Centre national de la recherche scientifique (CNRS), the Max-Planck-Gesellschaft (MPG, Germany) and the Spanish IGN (Instituto Geográfico Nacional). We gratefully acknowledge the support from the IRAM staff for its support during the observations. The Nançay Radio Observatory is operated by the Paris Observatory, associated with the CNRS and with the University of Orléans. The Caltech Submillimeter Observatory was supported by National Science Foundation grant AST 99-80846. The data were reduced and analysed thanks to the use of the GILDAS, class software (http://www.iram.fr/IRAMFR/GILDAS). This research has been supported by the Programme national de planétologie of INSU. Part of this research was carried out at the Jet Propulsion Laboratory, California Institute of Technology, under a contract with the National Aeronautics and Space Administration. Part of this work was supported by a fellowship from the James Clerk Maxwell Telescope at the Institute for Astronomy of the University of Hawaii. The James Clerk Maxwell Telescope has historically been operated by the Joint Astronomy Centre on behalf of the Science and Technology Facilities Council of the United Kingdom, the National Research Council of Canada and the Netherlands Organisation for Scientific Research. We are grateful to Henry E. Matthews for his continuous help and contribution to the observations of comets at JCMT. B. P. Bonev acknowledges support of NSF grant AST-2 009 398. N.X. Roth acknowledges support by the NASA Postdoctoral Program at the NASA Goddard Space Flight Center, administered by Universities Space Research Association under contract with NASA. Additional support from the NSF grant AST-1614471 for M.A. Cordiner, and by the Planetary Science Division Internal Scientist Funding Program through the Fundamental Laboratory Research (FLaRe) work package (S. N. Milam & M. A. Cordiner). The authors wish to recognise and acknowledge the very significant cultural role and reverence that the summit of Maunakea has always had within the indigenous Hawaiian community. We are most fortunate to have the opportunity to conduct observations from this mountain.
Appendix A Tables of observed lines
Line intensities from JCMT observations.
Line intensities from CSO observations.
Line intensities from IRAM observations.
Line intensities from IRAM observations.
Line intensities from IRAM observations.
References
- A’Hearn, M. F., Millis, R. L., Schleicher, D. G., Osip, D. J., & Birch, P. V. 1995, Icarus, 118, 223 [Google Scholar]
- Altwegg, K., & Bockelée-Morvan, D. 2003, Space Sci. Rev., 106, 139 [Google Scholar]
- Altwegg, K., Balsiger, H., Bar-Nun, A., et al. 2015, Science, 347, 1261952 [Google Scholar]
- Biver, N., & Bockelée-Morvan, D. 2019, ACS Earth Space Chem., 3, 1550 [Google Scholar]
- Biver, N., Bockelée-Morvan, D., Crovisier, J., et al. 2000, AJ, 120, 1554 [NASA ADS] [CrossRef] [Google Scholar]
- Biver, N., Bockelée-Morvan, D., Croviser, J., et al. 2002, Earth Moon Planets, 90, 323 [NASA ADS] [CrossRef] [Google Scholar]
- Biver, N., Bockelée-Morvan, D., Crovisier, J., et al. 2006, A&A, 449, 1255 [NASA ADS] [CrossRef] [EDP Sciences] [Google Scholar]
- Biver, N., Crovisier, J., Bockelée-Morvan, D., et al., 2012, A&A 539, A68 [NASA ADS] [CrossRef] [EDP Sciences] [Google Scholar]
- Biver, N., Bockelée-Morvan, D., Debout, V., et al. 2014, A&A, 566, A5 [NASA ADS] [CrossRef] [EDP Sciences] [Google Scholar]
- Biver, N., Bockelée-Morvan, D., Moreno, R., et al. 2015, Sci. Adv., 1, e1500863 [Google Scholar]
- Biver, N., Moreno, R., Bockelée-Morvan, D., et al. 2016, A&A, 589, A78 [NASA ADS] [CrossRef] [EDP Sciences] [Google Scholar]
- Biver, N., Bockelée-Morvan, D., Paubert, G., et al. 2018, A&A, 619, A127 [NASA ADS] [CrossRef] [EDP Sciences] [Google Scholar]
- Biver, N., Bockelée-Morvan, D., Boissier, J., et al. 2021, A&A, 648, A49 [EDP Sciences] [Google Scholar]
- Bockelée-Morvan, D., & Biver, N. 2017, Phil. Trans. R. Soc. A, 375, 20160252 [Google Scholar]
- Bockelée-Morvan, D., Crovisier, J., Colom, P., & Despois, D. 1994, A&A, 287, 647 [Google Scholar]
- Bockelée-Morvan, D., Hartogh, P., Crovisier, J., et al. 2010, A&A, 518, L149 [NASA ADS] [CrossRef] [EDP Sciences] [Google Scholar]
- Bockelée-Morvan, D., Calmonte, U., Charnley, S., et al. 2015, Space Sci. Rev., 197, 47 [Google Scholar]
- Bodewits, D., Farnham, T. L., Kelley, M. S. P., & Knight, M. M. 2018, Nature, 553, 186 [Google Scholar]
- Brasser, R., & Morbidelli, A. 2013, Icarus, 225, 40 [NASA ADS] [CrossRef] [Google Scholar]
- Calmonte, U., Altwegg, K., Balsiger, H., et al. 2016, MNRAS, 462, S253 [CrossRef] [Google Scholar]
- Carter, M., Lazareff, B., Maier, D., et al. 2012, A&A, 538, A89 [NASA ADS] [CrossRef] [EDP Sciences] [Google Scholar]
- Combi, M. R., Lee, Y., Patel, T. S., et al. 2011, AJ, 141, 128 [Google Scholar]
- Combi, M. R., Mäkinen, T. T., Bertaux, J.-L., Quémerais, E., & Ferron, S. 2019, Icarus, 317, 610 [Google Scholar]
- Cowley, S. W., 2016 Nature, 317, 381 [Google Scholar]
- Crovisier, J., Colom, P., Gérard, E., Bockelée-Morvan, D., Bourgois, G. 2002, A&A, 393, 1053 [NASA ADS] [CrossRef] [EDP Sciences] [Google Scholar]
- DiSanti, M. A., Bonev, B. P., Villanueva, G. L., & Mumma, M. J. 2013, ApJ, 763, 1 [Google Scholar]
- Faggi, S., Mumma, M. J., Villanueva, G. L., Paganini, L., & Lippi, M. 2019, AJ, 158, 254 [Google Scholar]
- Fink, U. 2009, Icarus, 201, 331 [Google Scholar]
- Gérard, E., Bockelée-Morvan, D., Bourgois, G., Colom, P., & Crovisier, J. 1988, A&AS, 74, 485 [Google Scholar]
- Hartogh, P., Lis, D. C., Bockelée-Morvan, D., et al. 2011, Nature, 478, 218 [Google Scholar]
- Huebner, W. F., Keady, J. J., Lyon, S. P. 1992, Ap&SS, 195, 1 [Google Scholar]
- Kelley, M. S. P., Bodewits, D., Quanzhi Ye, et al. 2019, Res. Notes Amer. Astron. Soc., 3, A126 [Google Scholar]
- Lamy, P. L., Toth, I., Fernandez, Y. R., & Weaver, H. A. 2004, in Comets II, eds. M., Festou, H. U., Keller, & H. A., Weaver) (University of Arizona Press), 223 [Google Scholar]
- Lis, D. C., Bockelée-Morvan, D., Güsten, R., et al., 2019, A&A 625, L5 [NASA ADS] [CrossRef] [EDP Sciences] [Google Scholar]
- Moulane, Y., Jehin, E., Opitom, C., et al. 2018, A&A, 619, A158 [NASA ADS] [CrossRef] [EDP Sciences] [Google Scholar]
- Müller, H. S. P., Schlöder, F., Stutzki J., & Winnewisser, G. 2005, J. Mol. Struct., 742, 215 [Google Scholar]
- O’Brien, D. P., Walsh, K. J., Morbidelli, A., Raymond, S. N., & Mandell, A. M. 2014, Icarus, 239, 74 [Google Scholar]
- Ootsubo, T., Kawakita, H., Hamada, S., et al. 2012, ApJ, 752, 15 [NASA ADS] [CrossRef] [Google Scholar]
- Ootsubo, T., Kawakita, H., Shinnaka, Y., et al. 2020, Icarus, 338, 113450 [Google Scholar]
- Pickett, H. M., Poynter, R. L., Cohen, E. A., et al. 1998, J. Quant. Spec. Rad. Transf., 60, 883 [Google Scholar]
- Roth, N. X., Gibb, E. L., Bonev, B. P., et al. 2020, AJ, 159, 42 [Google Scholar]
- Saki, M., Gibb, E. L., Bonev, B. P., et al. 2020, AJ, 160, 184 [Google Scholar]
- Schleicher, D. G., Knight, M. M., Eisner, N. L., & Thirouin, A. 2018, AJ, 157, 108 [Google Scholar]
- Weaver, H. A., Chin, G., Bockelée-Morvan, D., et al. 1999, Icarus, 142, 482 [Google Scholar]
- Zakharov, V., Bockelée-Morvan, D., Biver, N., Crovisier, J., & & Lecacheux, A. 2007, A&A, 473, 303 [NASA ADS] [CrossRef] [EDP Sciences] [Google Scholar]
All Tables
All Figures
|
Fig. 1 Lines observed with the JCMT 15-m in comet 21P: HCN(4–3) at 354 505.472 MHz between 30 October and 2 November 1998, and HCN(3–2) at 265 886.434 MHz on 4.2 November 1998 UT. Negative ‘ghost’ lines appear at ± 13.7 km s−1 (16.2 MHz) in the HCN(4–3) spectrum owing to the frequency switching technique. The position and relative intensity of the hyper-fine components are drawn below the spectra. The vertical scale is the main beam brightness temperature and the horizontal scale is the Doppler velocity in the comet rest frame. |
| In the text | |
|
Fig. 2 Lines observed with the JCMT 15-m in comet 21P: two CH3OH lines at 338 GHz on 31.3 October and one line at 350 905.100 MHz on 4.3 November 1998 UT (left side); H2 CO at 351 768.639 MHz on 3.2 November and CS at 342 882.850 MHz on 1.3 November 1998 UT (right side). The vertical scale is the main beam brightness temperature and the horizontal scale is the Doppler velocity in the comet rest frame. The frequency scale for the CH3 OH lines at 338 GHz is also provided on the upper axis. |
| In the text | |
|
Fig. 3 Lines observed with the CSO 10.4-m in comet 21P: HCN(3–2) at 265 886.434 MHz on 10–14 November 1998 UT, and CH3OH lines at 307 165.911 MHz (Upper Side Band, left upper axis scale) and 304 208.324 MHz (Image and Lower Side Band, right upper axis scale) on 14.3 November 1998 UT. The receiver tuning was adjusted in order to get those two methanol line in the same spectrum separated by 20 MHz. The vertical scale is the main beam brightness temperature and the horizontal scale is the Doppler velocity in the comet rest frame. The frequency range of 40.7 MHz for the CH3 OH spectrum corresponds to a 40 km s−1 Doppler velocity window as for HCN. A velocity scale centred on each line has been plotted on the lower axis of the methanol spectrum. |
| In the text | |
|
Fig. 4 HCN(3–2) line in comet 21P observed with the IRAM 30-m on 11.7–14.7 October 1998 and HCN(1–0) observed on 11.7–15.7 October 1998. Scales as in Fig. 1. |
| In the text | |
|
Fig. 5 CH3OH lines at 145 GHz in comet 21P observed with the IRAM 30-m on 14.2–17.2 September 2018 UT. The vertical scale is the main beam brightness temperature and the horizontal scale is the Doppler velocity in the comet rest frame and the rest frequency in MHz is provided on the upper axis. |
| In the text | |
|
Fig. 6 CH3OH lines at 165 GHz in comet 21P observed with the IRAM 30-m on 16.1–18.2 September 2018 UT. Scales as in Fig. 5. |
| In the text | |
|
Fig. 7 Observations of comet 21P with the IRAM 30-m in 2018: HCN(1–0) on 14.2–17.8 September, CS(3–2) and CH3 CN on 14.2–17.2 September and H2S(110 − 101) on 16.1–18.2 September UT. Scales as in Fig. 1. All the spectra are plotted with the same intensity scale and Doppler velocity range (40 km s−1). The rest frequency in MHz is provided on the upper axis of CH3CN lines. |
| In the text | |
|
Fig. 8 HCN(3–2) line in comet 41P observed with the IRAM 30-m on 26–31 April 2017. Scales as in Fig. 1. |
| In the text | |
|
Fig. 9 CH3OH lines at 242 GHz in comet 41P observed with the IRAM 30-m on 26.1 April 2017. The vertical scale is the main beam brightness temperature and the horizontal scale is the Doppler velocity in the comet rest frame and the rest frequency in MHz is provided on the upper axis. |
| In the text | |
|
Fig. 10 HCN(3–2) line in comet 64P/Swift-Gehrels observed with the IRAM 30-m on 11.8 December 2018. Scales as in Fig. 1. |
| In the text | |
|
Fig. 11 CH3OH lines at 242 GHz in comet 64P/Swift-Gehrels observed with the IRAM 30-m on 17.9 December 2018. Scales as in Fig. 9. |
| In the text | |
|
Fig. 12 Rotational diagram of the methanol lines at 165 GHz in comet 21P. We plot the logarithm of a quantity which should be proportional to the average upper level population in the beam (for optically thin line, Bockelée-Morvan et al. 1994) against the energy of the upper level, for each transition. At thermal equilibrium at T all points should align on a line of slope 1∕T. The blackdots with errorbars are the observed values, with upper level of the corresponding transition labelled above. The red line shows the best fit to the observations, with dashed lines for the ± 1σ values of the rotational temperature given above the plot. Green circles show the predicted values for a model with a Tgas = 42 K implying a rotational temperature of 41.7 K. |
| In the text | |
|
Fig. 13 Rotational diagram of the methanol lines at 242 GHz in comet 64P/Swift Gehrels. Scales are as is Fig. 12. The green circles show the predicted values for a model with a gas temperature Tgas = 50 K which implies a lower rotational temperature of 19.5 K. |
| In the text | |
|
Fig. 14 Evolution of the production rates of comet 21P. Empty symbols (left side) are production rates measured in October–November 1998 a few days before perihelion (rh = 1.034 on 21.3 November 1998). Filled symbols correspond to measurements of 2018, shortly after perihelion (rh = 1.013 on 10.3 September 2018). Downward pointing empty triangles are upper limits (for CO in dark blue, H2 S in red and HNC in blue) for the corresponding period. The vertical scale is the production rate in molec. s−1, and the horizontal scale the date of observation relative to the relevant perihelion date. |
| In the text | |
Current usage metrics show cumulative count of Article Views (full-text article views including HTML views, PDF and ePub downloads, according to the available data) and Abstracts Views on Vision4Press platform.
Data correspond to usage on the plateform after 2015. The current usage metrics is available 48-96 hours after online publication and is updated daily on week days.
Initial download of the metrics may take a while.