Fig. 14
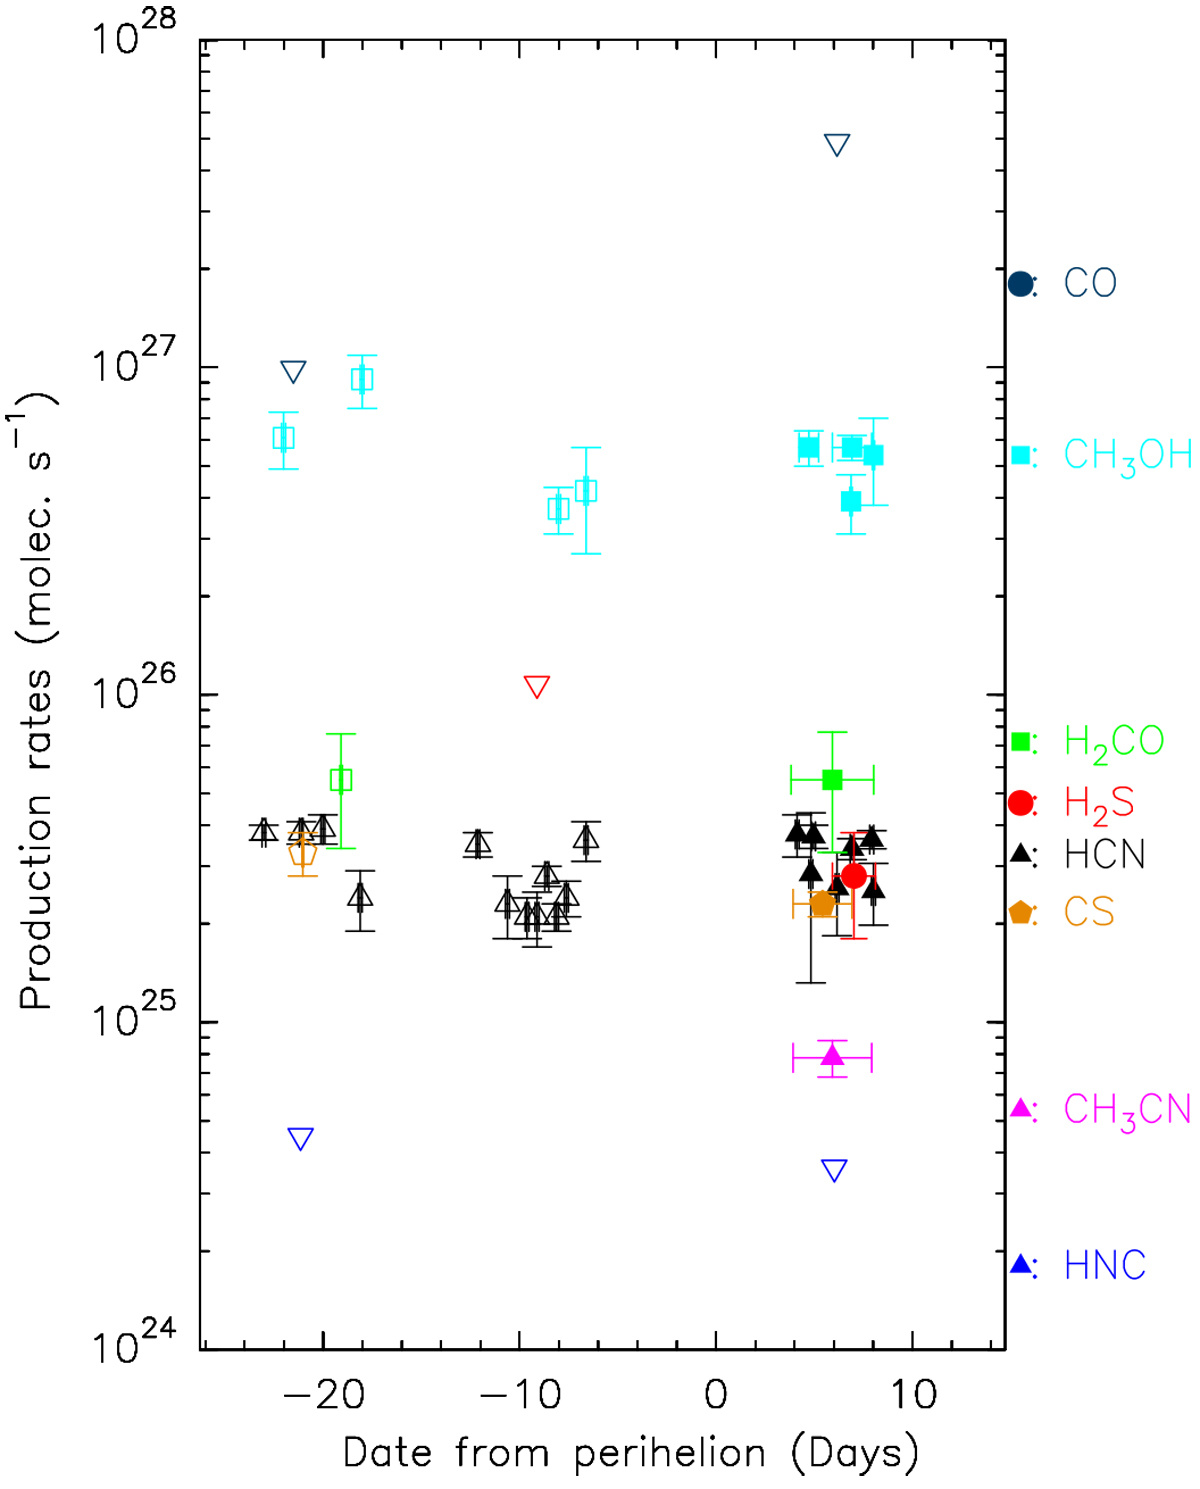
Evolution of the production rates of comet 21P. Empty symbols (left side) are production rates measured in October–November 1998 a few days before perihelion (rh = 1.034 on 21.3 November 1998). Filled symbols correspond to measurements of 2018, shortly after perihelion (rh = 1.013 on 10.3 September 2018). Downward pointing empty triangles are upper limits (for CO in dark blue, H2 S in red and HNC in blue) for the corresponding period. The vertical scale is the production rate in molec. s−1, and the horizontal scale the date of observation relative to the relevant perihelion date.
Current usage metrics show cumulative count of Article Views (full-text article views including HTML views, PDF and ePub downloads, according to the available data) and Abstracts Views on Vision4Press platform.
Data correspond to usage on the plateform after 2015. The current usage metrics is available 48-96 hours after online publication and is updated daily on week days.
Initial download of the metrics may take a while.