Fig. 12
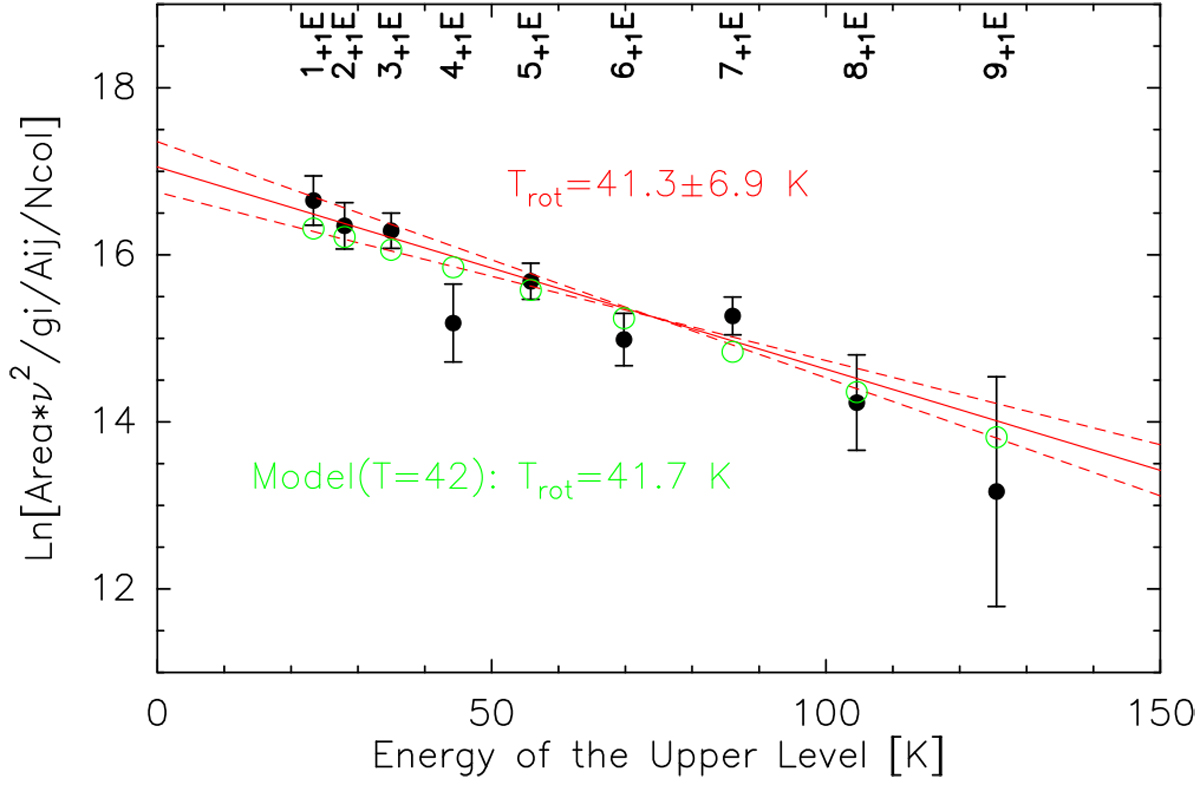
Rotational diagram of the methanol lines at 165 GHz in comet 21P. We plot the logarithm of a quantity which should be proportional to the average upper level population in the beam (for optically thin line, Bockelée-Morvan et al. 1994) against the energy of the upper level, for each transition. At thermal equilibrium at T all points should align on a line of slope 1∕T. The blackdots with errorbars are the observed values, with upper level of the corresponding transition labelled above. The red line shows the best fit to the observations, with dashed lines for the ± 1σ values of the rotational temperature given above the plot. Green circles show the predicted values for a model with a Tgas = 42 K implying a rotational temperature of 41.7 K.
Current usage metrics show cumulative count of Article Views (full-text article views including HTML views, PDF and ePub downloads, according to the available data) and Abstracts Views on Vision4Press platform.
Data correspond to usage on the plateform after 2015. The current usage metrics is available 48-96 hours after online publication and is updated daily on week days.
Initial download of the metrics may take a while.