Fig. 7.
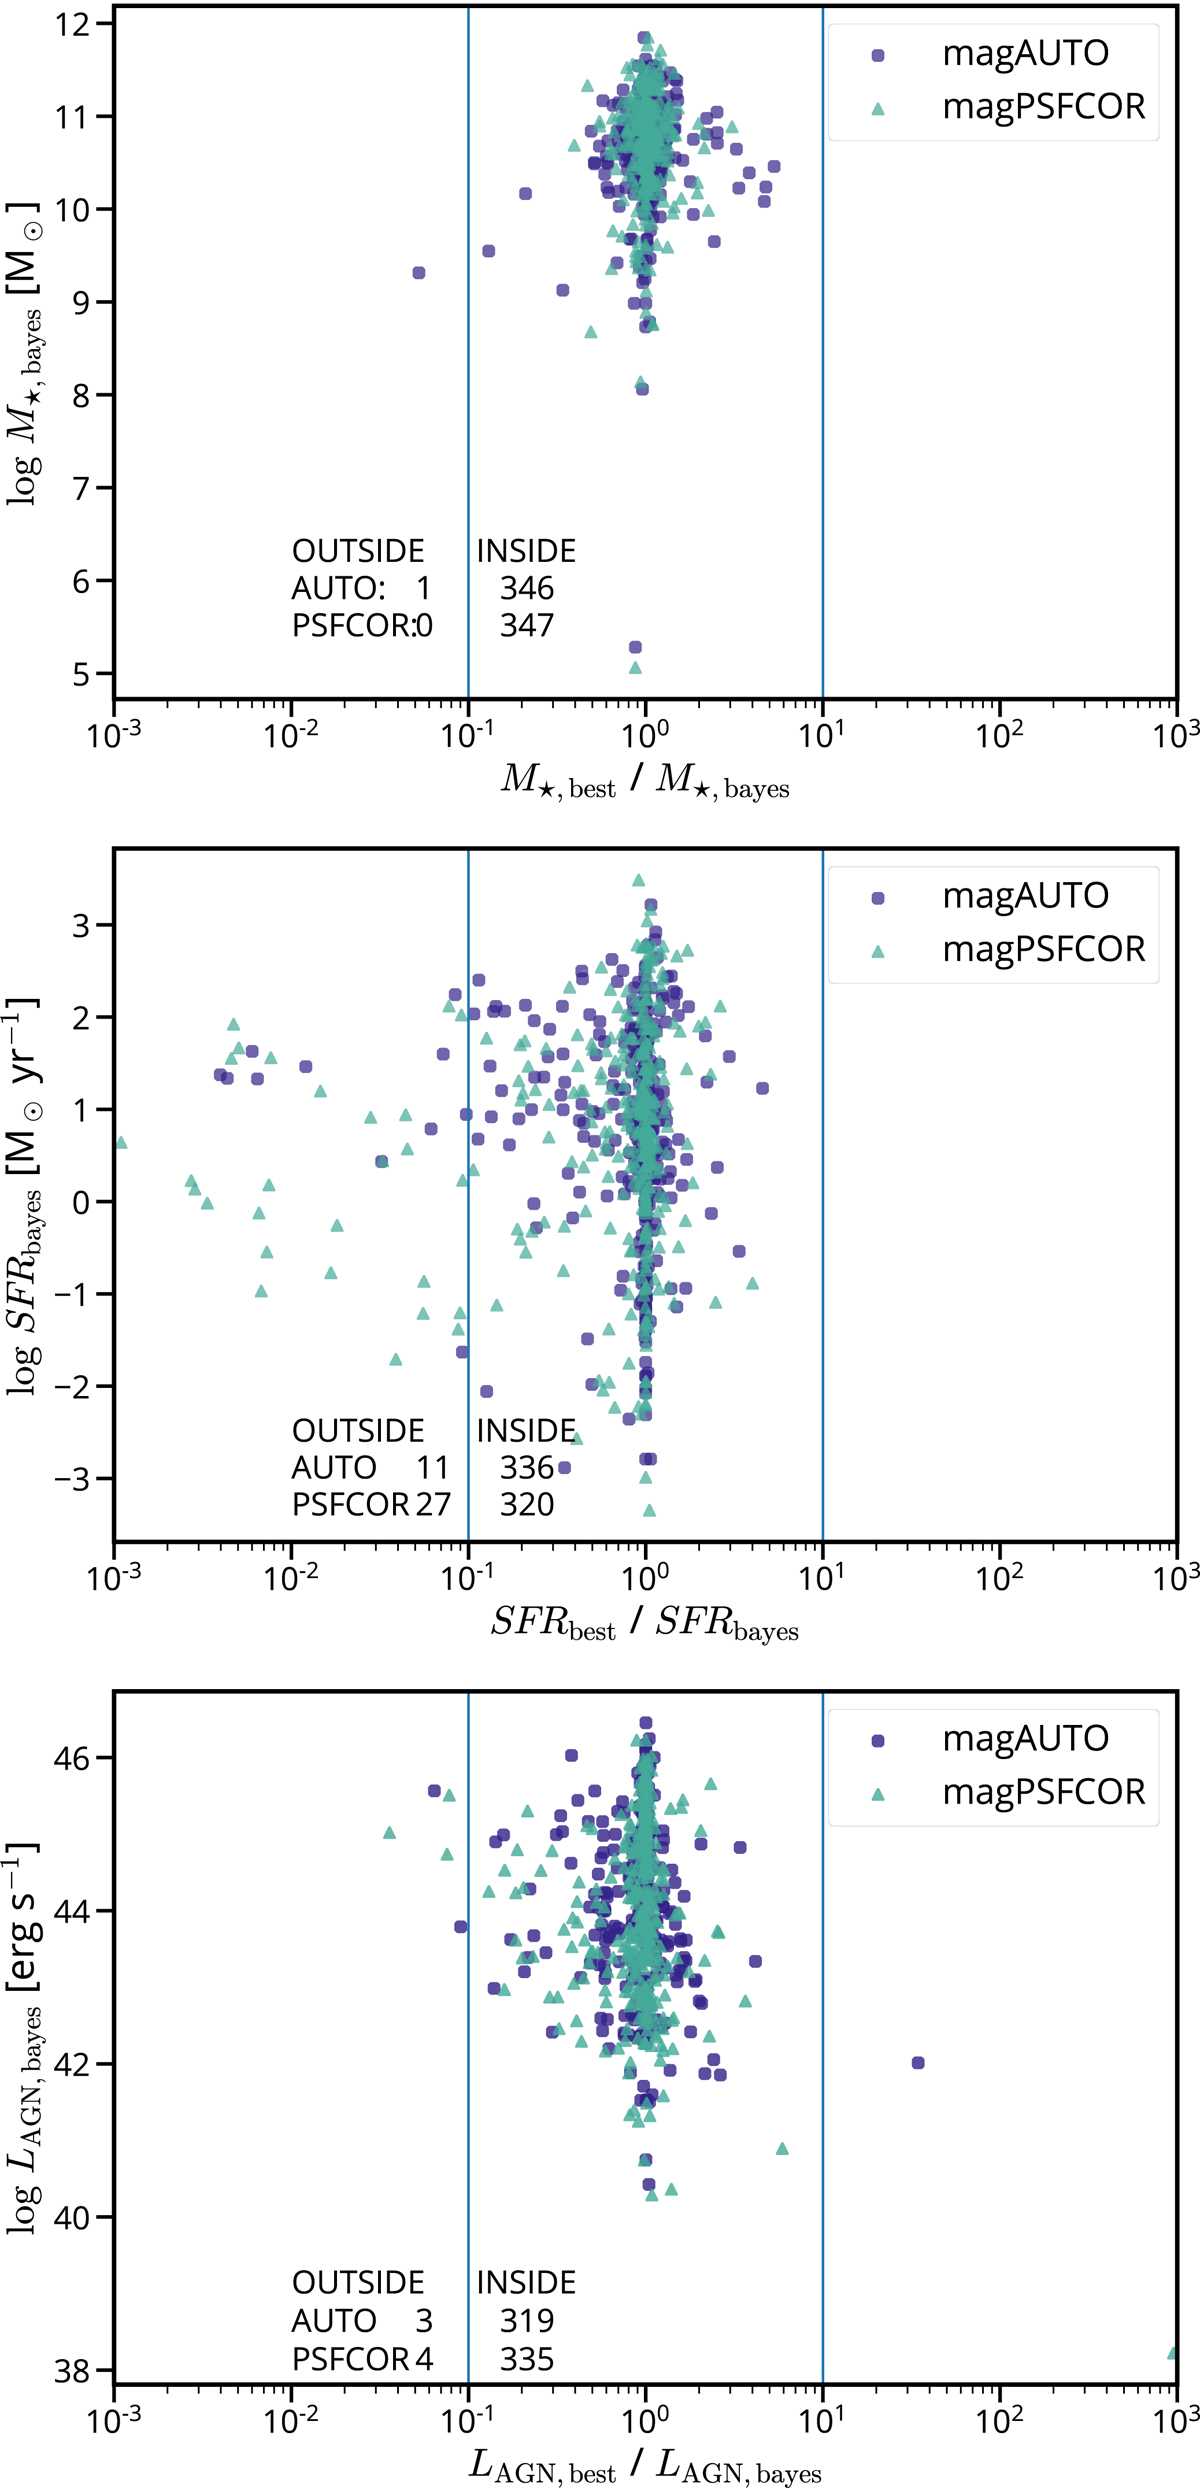
Download original image
Criteria used to exclude the sources with unreliable physical parameters. The bayesian values for M⋆ (upper panel), SFR (middle panel), and LAGN (lower panel) are plotted against the ratio of best values over Bayesian. The distribution is centered at 1. The solid vertical lines mark the limits of 0.1 and 10 adopted in this work (see Sect. 3.3 for details). The different colors show the parameters and ratios obtained assuming different magnitudes as input. The number of sources between and outside the limits is reported in the lower part of the plots.
Current usage metrics show cumulative count of Article Views (full-text article views including HTML views, PDF and ePub downloads, according to the available data) and Abstracts Views on Vision4Press platform.
Data correspond to usage on the plateform after 2015. The current usage metrics is available 48-96 hours after online publication and is updated daily on week days.
Initial download of the metrics may take a while.