Fig. 14.
Download original image
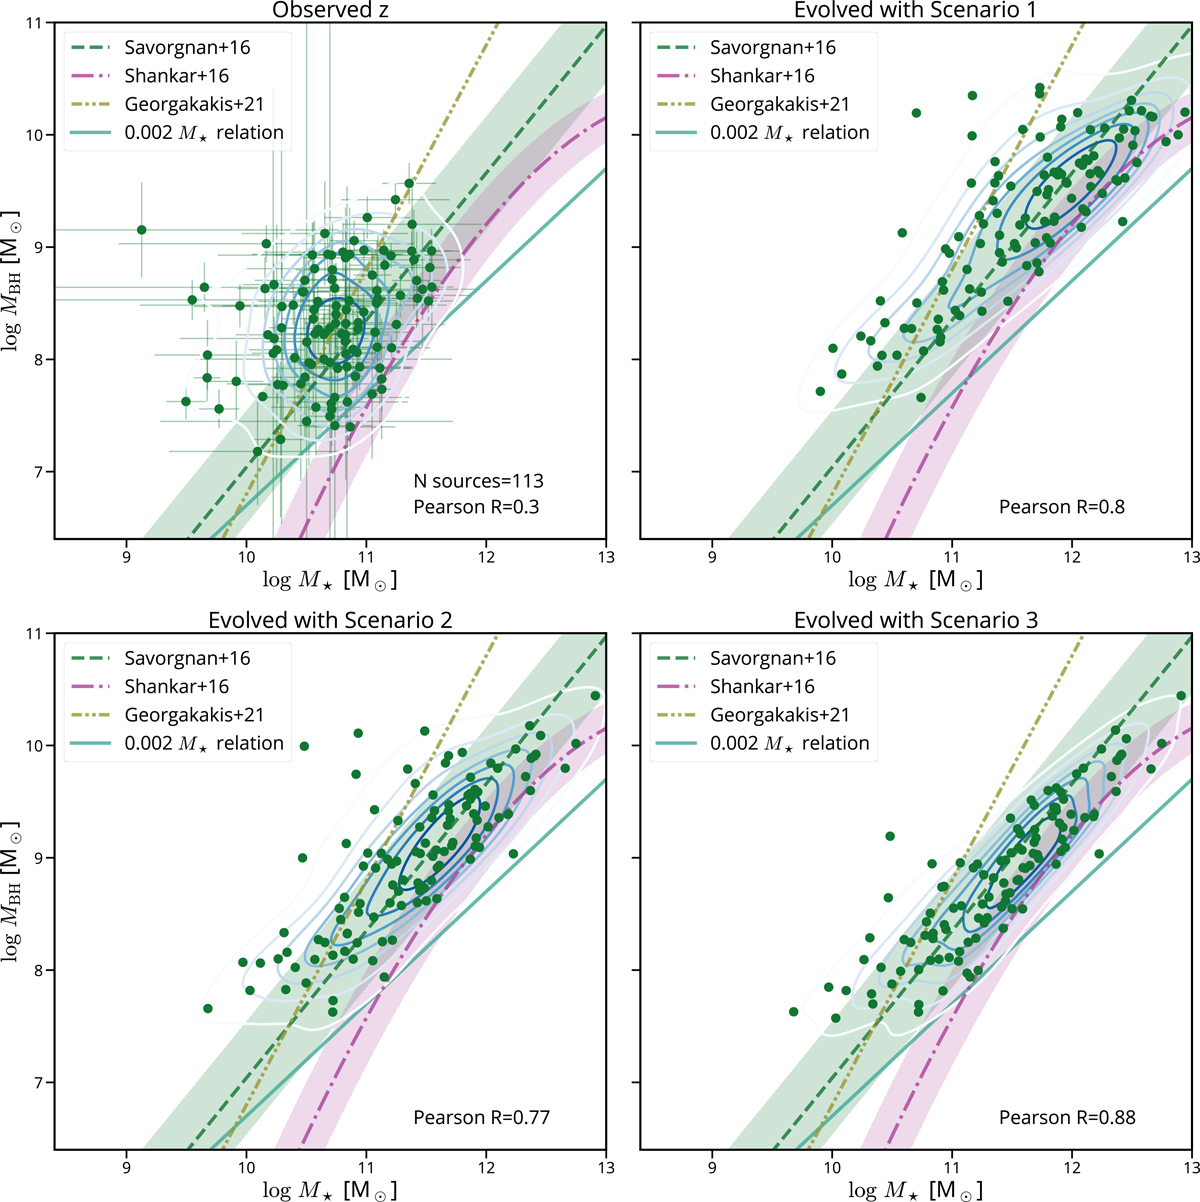
Upper left panel: the observed MBH − M⋆ relation for all the 113 sources in our sample, at the observed redshift. Green solid dots are the value of masses for each source, with associated uncertainties, while contours are the distribution of these dots. In all panels, we show the expected local MBH − M⋆ scaling relations: in turquoise the 0.002 M⋆ from Marconi & Hunt (2003); in green the relation from Savorgnan et al. (2016) with uncertanties at 1-σ; in purple the unbiased version from Shankar et al. (2016) with uncertanties; and in brown the parametrization by Georgakakis et al. (2021). The other three panels show the forward modeling of our sources to z = 0 using different methods. Upper right panel: the most basic model, with constant rates (Scenario 1). Lower left panel: the model with a variable rate following the SFH (Scenario 2). Lower right panel: the model with a variable rate following the SFH and the energy limit for the black hole accretion (Scenario 3). See Sect. 6 for details. We also show the number of sources and the Pearson correlation value on each bottom right corner.
Current usage metrics show cumulative count of Article Views (full-text article views including HTML views, PDF and ePub downloads, according to the available data) and Abstracts Views on Vision4Press platform.
Data correspond to usage on the plateform after 2015. The current usage metrics is available 48-96 hours after online publication and is updated daily on week days.
Initial download of the metrics may take a while.