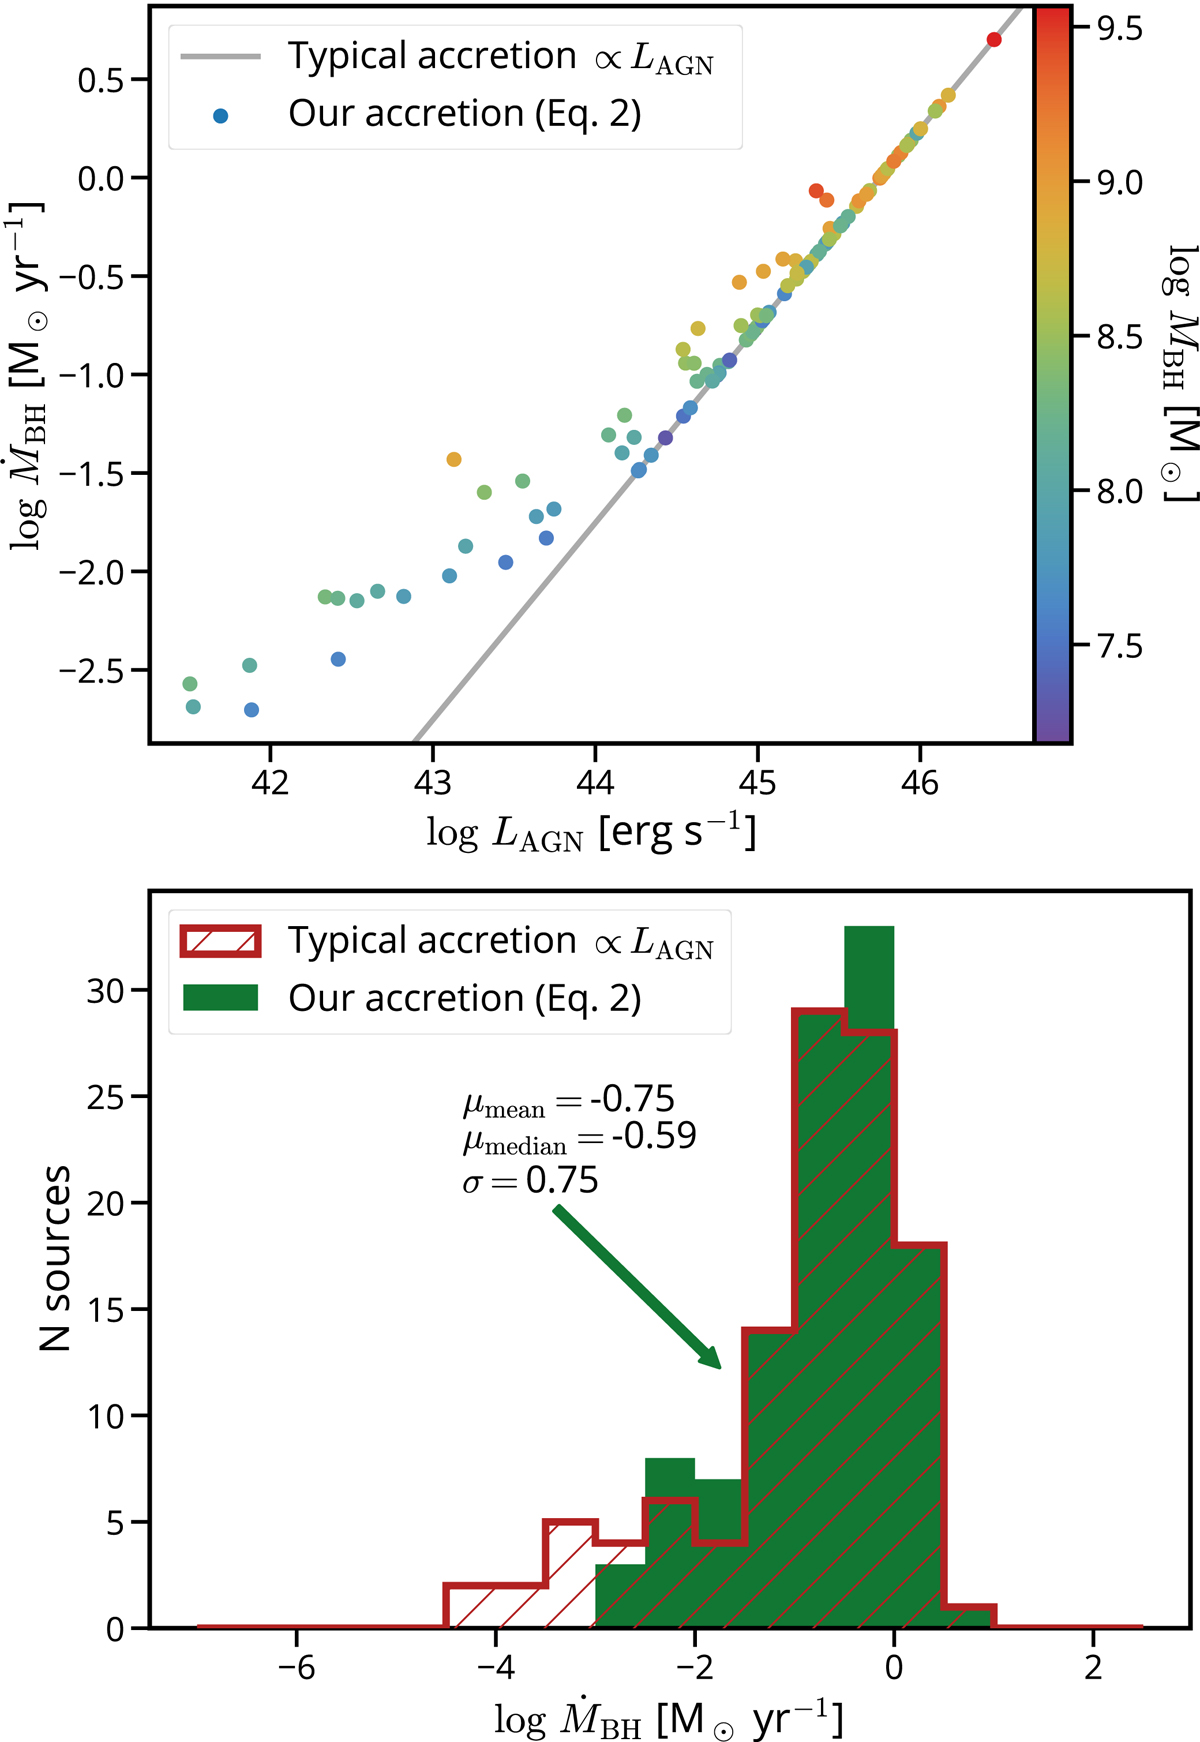
Fig. 13.
Download original image
Upper panel: accretion rate depending on LAGN. The solid line is the typical accretion rate assuming a linear dependence with LAGN, and it is equal for our sources with λ > λcrit. For the rest of the sources, the dispersion comes from the dependence with MBH, which is color-coded. Lower panel: histogram of the estimated BH accretion rates.
Current usage metrics show cumulative count of Article Views (full-text article views including HTML views, PDF and ePub downloads, according to the available data) and Abstracts Views on Vision4Press platform.
Data correspond to usage on the plateform after 2015. The current usage metrics is available 48-96 hours after online publication and is updated daily on week days.
Initial download of the metrics may take a while.