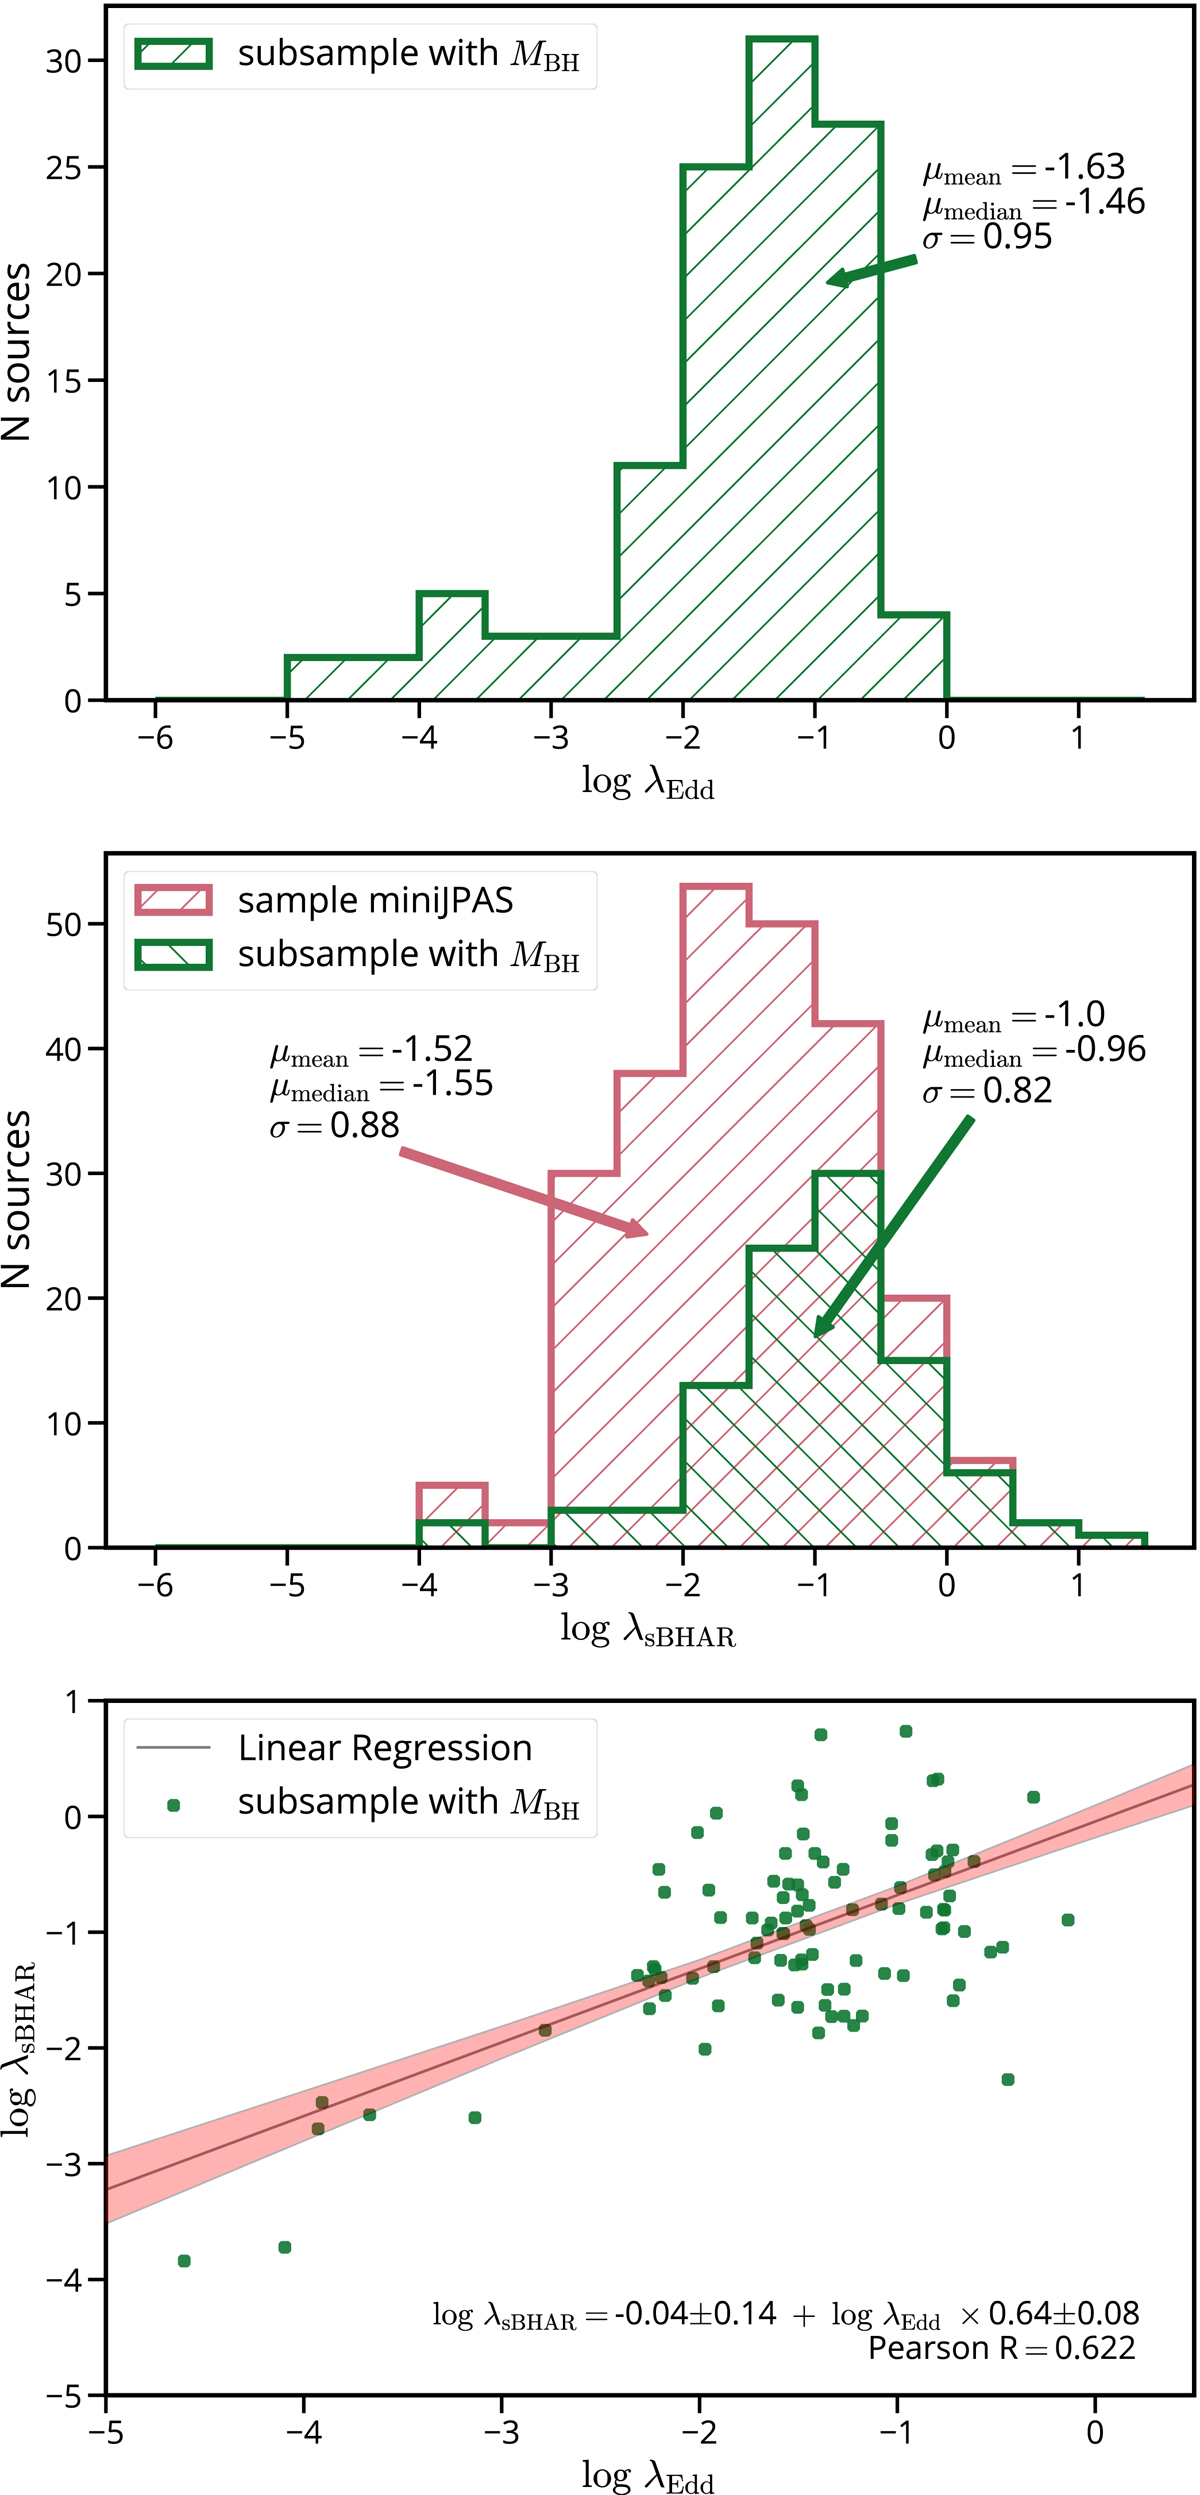
Fig. 12.
Download original image
Distribution of accretion rates derived in this work. Upper panel: histogram of Eddington accretion rate (λEdd) for the sources with measured MBH. Middle panel: histogram of the specific accretion rate (λsBHAR, typically used as proxy of λEdd), for both the sample with measured BH masses and the full miniJPAS sample. A difference in the shape of distributions can be seen for the subsample with measured BH masses by comparing the green histograms in the upper and middle panels. Lower panel: plot of the relation between λsBHAR − λEdd. While they are defined to be equal, we found a poor correlation value and a systematic shift from the 1:1 relation in their linear regression (plotted as gray with 1-σ uncertainties in pink).
Current usage metrics show cumulative count of Article Views (full-text article views including HTML views, PDF and ePub downloads, according to the available data) and Abstracts Views on Vision4Press platform.
Data correspond to usage on the plateform after 2015. The current usage metrics is available 48-96 hours after online publication and is updated daily on week days.
Initial download of the metrics may take a while.