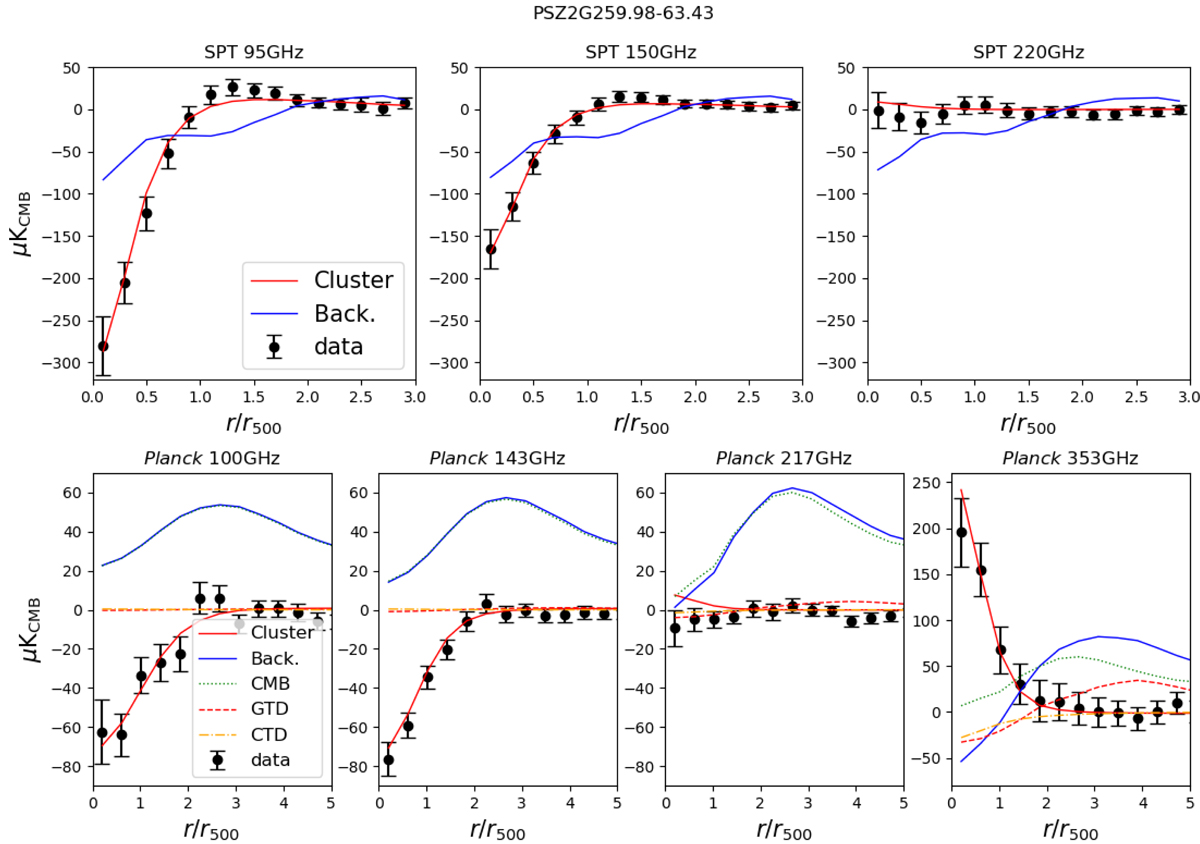
Fig. 4.
Download original image
Radial profile around PSZ2G259.98-63.43 for the three SPT channels (95-150-220, upper panels) and four Planck channels (100-143-217-353, lower panels). The black dots represent the radial average on the SZ maps, the red line is the best fit of the cluster profile, and the blue line is the radial mean of the total background signal. For Planck data, we also show the individual components of the background model: the dotted cyan line is the CMB, the dashed red line is the GTD, and the dash-dotted orange line is the cluster dust component.
Current usage metrics show cumulative count of Article Views (full-text article views including HTML views, PDF and ePub downloads, according to the available data) and Abstracts Views on Vision4Press platform.
Data correspond to usage on the plateform after 2015. The current usage metrics is available 48-96 hours after online publication and is updated daily on week days.
Initial download of the metrics may take a while.