Fig. 3.
Download original image
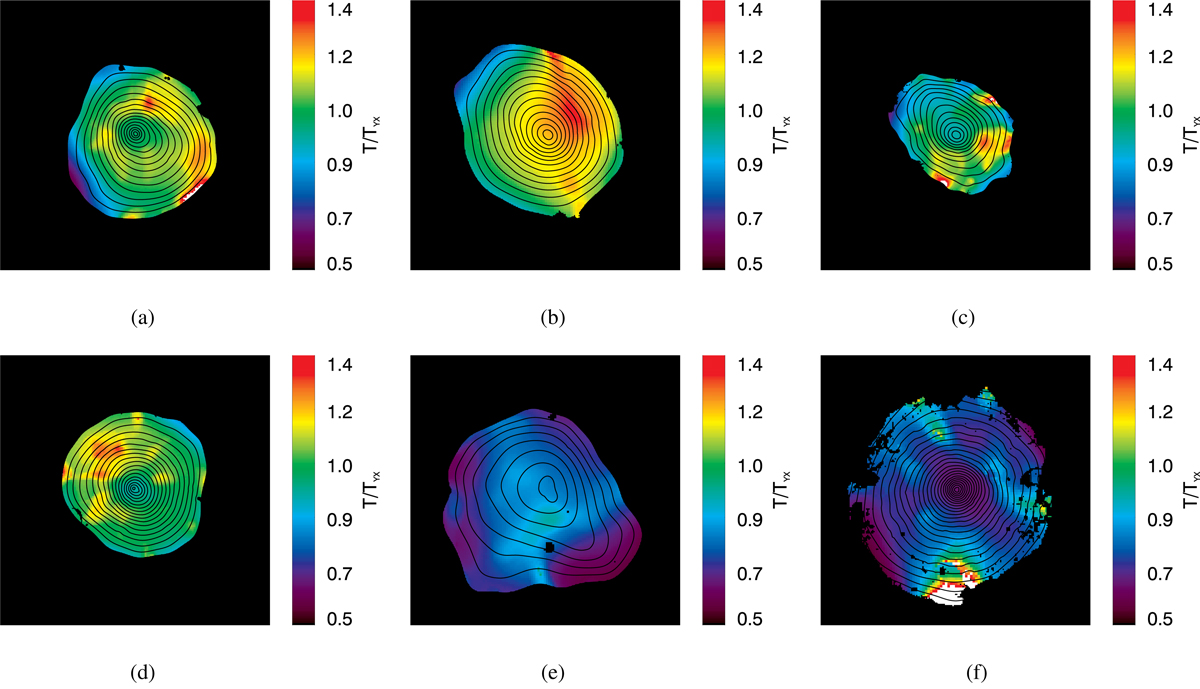
Normalised cluster temperature maps overlaid on the point-source-removed X-ray surface brightness isocontours, as obtained from XMM-Newton data. The size of the maps is 2r500 × 2r500 centred on the X-ray peak. Contour levels are equally spaced by ![]() in log ΣX. The temperature maps are expressed in terms of TYX, the mean spectroscopic temperature for the YX scaling relation estimated in the intra-cluster radius range [0.15, 0.75] r500. The relative 1σ uncertainty varies greatly from the centre to the outskirts; for the unmasked regions it is ∼18%, on average. For all clusters but PSZ2G339.63-69, surface brightness contours and temperature maps were extracted in the energy bands [0.5 − 2.5] keV and [0.3, 12] keV, respectively. The surface brightness contours and temperature map of PSZ2G339.63-69 were extracted in the energy band [0.5 − 2] keV to reduce the contamination from the AGN, as detailed in Sect. 3.2.6. (a) PSZ2G259.98-63.43, (b) PSZ2G262.73-40.92, (c) PSZ2G263.68-22.55, (d) PSZ2G271.18-30.95, (e) PSZ2G277.76-51.74, (f) PSZ2G339.63-69.
in log ΣX. The temperature maps are expressed in terms of TYX, the mean spectroscopic temperature for the YX scaling relation estimated in the intra-cluster radius range [0.15, 0.75] r500. The relative 1σ uncertainty varies greatly from the centre to the outskirts; for the unmasked regions it is ∼18%, on average. For all clusters but PSZ2G339.63-69, surface brightness contours and temperature maps were extracted in the energy bands [0.5 − 2.5] keV and [0.3, 12] keV, respectively. The surface brightness contours and temperature map of PSZ2G339.63-69 were extracted in the energy band [0.5 − 2] keV to reduce the contamination from the AGN, as detailed in Sect. 3.2.6. (a) PSZ2G259.98-63.43, (b) PSZ2G262.73-40.92, (c) PSZ2G263.68-22.55, (d) PSZ2G271.18-30.95, (e) PSZ2G277.76-51.74, (f) PSZ2G339.63-69.
Current usage metrics show cumulative count of Article Views (full-text article views including HTML views, PDF and ePub downloads, according to the available data) and Abstracts Views on Vision4Press platform.
Data correspond to usage on the plateform after 2015. The current usage metrics is available 48-96 hours after online publication and is updated daily on week days.
Initial download of the metrics may take a while.