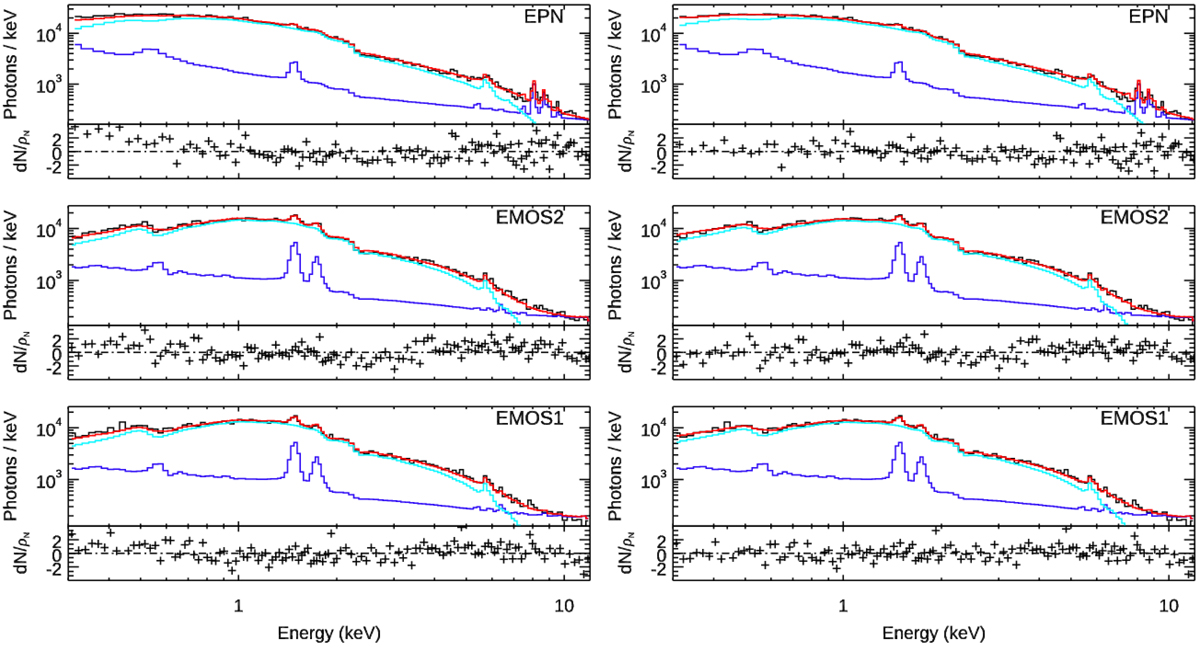
Fig. A.2.
Download original image
Fit and residuals of the X-ray spectrum of PSZ2G263.68-22.55 when we assume the molecular hydrogen column density from Bourdin et al. (in prep.) (left panel) or when NH is free to vary in the fit (right). For the three cameras (EPN, MOS1, and MOS2) of the XMM-Newton telescope, the light blue curve is the fitted model of the cluster spectrum, the dark blue line represents the total contribution from the background or foreground components (CXB plus QPB, SP, and the Galactic emission, see Sect. 3.2.2), the red curve is the sum of these two components, and the black curve is the observed spectrum.
Current usage metrics show cumulative count of Article Views (full-text article views including HTML views, PDF and ePub downloads, according to the available data) and Abstracts Views on Vision4Press platform.
Data correspond to usage on the plateform after 2015. The current usage metrics is available 48-96 hours after online publication and is updated daily on week days.
Initial download of the metrics may take a while.