| Issue |
A&A
Volume 671, March 2023
|
|
|---|---|---|
| Article Number | L3 | |
| Number of page(s) | 4 | |
| Section | Letters to the Editor | |
| DOI | https://doi.org/10.1051/0004-6361/202345937 | |
| Published online | 01 March 2023 | |
Letter to the Editor
Temporal albedo variability in the phase curve of KELT-1b
1
Instituto de Astrofísica de Canarias (IAC), 38200 La Laguna, Tenerife, Spain
e-mail: This email address is being protected from spambots. You need JavaScript enabled to view it.
2
Departamento de Astrofísica, Universidad de La Laguna (ULL), 38206 La Laguna, Tenerife, Spain
Received:
18
January
2023
Accepted:
9
February
2023
Abstract
The dayside brightness spectrum of a highly irradiated transiting brown dwarf KELT-1b is challenging to explain based on current brown dwarf atmosphere models. The spectrum has been measured from observations spanning ten years and covering high-precision secondary eclipses and phase curves from space in blue-visible (CHaracterising ExOPlanet Satellite, CHEOPS), red-visible (Transiting Exoplanet Survey Satellite, TESS), and near-infrared (Spitzer), as well as secondary eclipse observations in near-infrared from the ground. First, the dayside of KELT-1b was observed to be brighter in the TESS passband than expected, based on earlier near-infrared phase curve observations with Spitzer, and, recently, the dayside was observed to be extremely dark in the CHEOPS passband. While several theories have been proposed to reconcile the discrepancy between the TESS and Spitzer bands, explaining the difference between the largely overlapping CHEOPS and TESS bands has proven more difficult. In this work, I model the TESS photometry from Sector 17 together with the new TESS photometry from Sector 57 and show that the discrepancies in KELT-1b’s dayside brightness spectrum are best explained by temporal variability in KELT-1b’s albedo. This variability is most likely due to changes in the weather, namely, variations in the silicate cloud coverage on the brown dwarf’s dayside.
Key words: stars: individual: KELT-1 / brown dwarfs / planetary systems / planets and satellites: atmospheres / stars: atmospheres / methods: observational
© The Authors 2023
 Open Access article, published by EDP Sciences, under the terms of the Creative Commons Attribution License (https://creativecommons.org/licenses/by/4.0), which permits unrestricted use, distribution, and reproduction in any medium, provided the original work is properly cited.
This article is published in open access under the Subscribe to Open model. This email address is being protected from spambots. You need JavaScript enabled to view it. to support open access publication.
1. Introduction
KELT-1b (Siverd et al. 2012) is a strongly irradiated brown dwarf transiting a 6500 K F5-star on a short-period orbit of 1.2 days. The brown dwarf’s dayside brightness spectrum has been measured using secondary eclipse and phase curve observations from space in blue-visible (CHaracterising ExOPlanet Satellite, CHEOPS, Parviainen et al. 2022), red-visible (TESS, Beatty et al. 2020; von Essen et al. 2021), and near-infrared (Spitzer, Beatty et al. 2014, 2019), as well as in the near-infrared (NIR) from the ground (Croll et al. 2015; Beatty et al. 2017).
Originally, KELT-1b’s dayside brightness temperature estimates from the ground-based eclipse observations by Croll et al. (2015) and Beatty et al. (2017) agreed reasonably well with the estimate of ∼2900 K from the Spitzer eclipse and phase curve observations in NIR1 (Beatty et al. 2014, 2019). However, high-precision phase curve observations in red-visible by TESS (Sector 17) showed an unexpectedly high dayside brightness that did not agree with the original atmosphere models based on Spitzer observations (Beatty et al. 2020; von Essen et al. 2021).
Two theories have been proposed to reconcile the discrepancy between the TESS and Spitzer dayside brightnesses. First, Beatty et al. (2020) proposed the discrepancy to be due to a high albedo in the visible caused by silicate clouds. KELT-1b’s dayside is too hot for clouds to form, but its nightside temperature should be cool enough for the formation of silicate clouds that could be blown over from the nightside to the dayside by winds (see Gao & Powell 2021, and the references therein). Second, von Essen et al. 2021 proposed that the discrepancy can be explained by collision-induced absorption due to H2–H2 and H2–He decreasing the brightness temperature in the Spitzer bands. That is, rather than the brightness of the TESS passband being boosted by reflection from clouds, the brightness in the Spitzer band would be suppressed by molecular absorption.
Recently, another discrepancy was observed between new blue-visible eclipse observations by CHEOPS and the red-visible observations by TESS. The CHEOPS observations suggested that KELT-1b’s dayside is very dark in the CHEOPS band, while the TESS observations showed it to be bright, even though the two passbands have a significant overlap (Parviainen et al. 2022).
In this Letter, I present a likely explanation for the abovementioned discrepancies based on a phase curve analysis of KELT-1b using a TESS light curve from Sector 17 and a new TESS light curve from Sector 57. The data and code for the analysis and figures are publicly available from GitHub2.
2. Observations
The Transiting Exoplanet Survey Satellite (TESS, Ricker et al. 2014) observed KELT-1b during Sector 17 for 25 days (2019 Oct. 08–2019 Nov. 02) and Sector 57 for 29 days (2022 Sep. 9–2022 Oct. 10) with a two-minute cadence3. I chose to use the Presearch Data Conditioning (PDC-SAP) light curve (Stumpe et al. 2014, 2012; Smith et al. 2012) produced by the SPOC pipeline (Jenkins et al. 2016), and remove all the exposures with a non-zero quality flag. Otherwise, the PDC-SAP photometry is used in the analysis as-is without any additional detrending. Instead, I used a CELERITE-based (Foreman-Mackey et al. 2017) time-dependent Gaussian process (GP) with loosely constrained hyperparameters to account for time-dependent variability in the analysis, as detailed later in this work.
3. Theory and numerical methods
The posteriors for all physical quantities of interest are estimated using a standard Bayesian parameter estimation approach (Parviainen 2018), as in Parviainen et al. (2022). I modelled the TESS photometry for both sectors simultaneously using a PYTRANSIT-based phase curve model, described in detail in Parviainen et al. (2022). The orbital parameters (zero epoch, impact parameter, stellar density,  , and
, and  ), Doppler beaming amplitude, ellipsoidal variation amplitude, and the brown-dwarf to star area ratio do not depend on the TESS sector, but the limb darkening coefficients4 and phase-curve parameters (maximum and minimum surface brightness ratios and hotspot offset) were allowed to vary from one sector to another. The orbital parameters and the area ratio are given loosely constraining priors based on Parviainen et al. (2022), and the limb darkening and phase curve parameters were given uninformative priors.
The GP uses the Matern32Term CELERITE term that approximates the Matern-3/2 covariance kernel. The GP hyperparameters are sector-dependent and constrained with loosely informative normal priors.
4. Results and discussion
The flux ratio5 posterior estimates are listed in Table 1, with the GP hyperparameter priors and posteriors in Table 2, the surface brightness ratio posteriors in Fig. 1, together with the CHEOPS posterior estimate from Parviainen et al. (2022), and the posterior phase curve models in Figs. 2 and 3. The area ratio, orbital parameters, ellipsoidal variation, and Doppler beaming estimates are all in agreement with the previous results in Parviainen et al. (2022) (and are not listed).
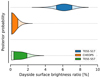 |
Fig. 1. Dayside brown dwarf to star flux ratio posteriors measured from TESS Sector 17 photometry, CHEOPS secondary eclipse observations, and TESS Sector 57 photometry. The y-axis offsets represent the average time differences between the observation sets (one year between the TESS S. 17 and CHEOPS observations and two years between the CHEOPS and TESS S. 57 observations). |
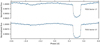 |
Fig. 2. TESS photometry from Sectors 17 and 57 with the posterior GP variability model removed, folded over the KELT-1b orbital phase and binned over 15 min as blue points (the error bars are smaller than the points) and the median posterior phase curve model (with uncertainties smaller than the line width). |
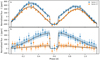 |
Fig. 3. Folded TESS photometry from Sectors 17 and 57 centred around the eclipse and binned over 43 min (panel a), and with the stellar ellipsoidal variation and Doppler beaming signals removed to show only the phase curve signal from KELT-1b (panel b). |
Dayside flux ratios and eclipse depths with their uncertainties.
Priors and posteriors for the CELERITE Matern-3/2 term hyperparameters and the white noise standard deviation.
Figure 3 visualises the differences between the TESS Sector 17 and 57 phase curves. The TESS Sector 17 observations were carried out in October 2019, the CHEOPS observations in October and November 2020, and the TESS Sector 57 observations in September 2022. While the differences between the TESS Sector 17 and CHEOPS brightnesses could be accounted for by exotic atmosphere chemistry (see discussion in Parviainen et al. 2022), the differences between the two TESS sectors can be only explained by temporal variability. The most likely source of temporal variability that can cause the discrepancies comes from variability in the cloud cover that changes KELT-1b’s dayside albedo.
The variability likely occurs over relatively long time scales. von Essen et al. (2021) previously studied possible time variability in the TESS light curve from Sector 17, but concluded that the short-time-scale variability in phase curve shapes they discovered was due to stellar variability that disappeared after the stellar variability was taken into account (von Essen et al. 2021). Parviainen et al. (2022) repeated the eclipse-to-eclipse variability analysis using a GP to model the stellar variability and concluded that the per-eclipse signal-to-noise ratio (S/N) was too low for both TESS and CHEOPS to detect any short-term variability in the eclipse depths. However, the individual eclipse depths did not show any long-term trends in a time scale of two months covered by the CHEOPS observations.
Using a GP to model the time-dependent variability comes with the risk of the GP fitting the phase curve signal. This is especially the case since I allowed the hyperparameters to differ for each sector. I tested whether overfitting by GP could explain the difference between the two sectors by carrying out a separate analysis without a GP. The analysis does not model the time-dependent variability in any way and is robust to overfitting. The test analysis results support the primary analysis6 and I conclude that the GP does not overfit the data in the primary analysis.
As a sanity check, I repeated the analysis separately for each sector to see whether the parameters assumed to be sector-independent parameters showed any variability. All the orbital parameters, the area ratio, and ellipsoidal variation amplitude agreed within uncertainties between the two sectors. Thus, stellar variability is unlikely to be behind the discrepancy. Additionally, Siverd et al. (2012) find KELT-1 to be a relatively quiet star with rms scatter of 9.8 mmag measured over an observing period of 4.2 years, and the TESS light curves do not show any significant variability, as shown in Fig. 4.
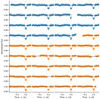 |
Fig. 4. TESS Sector 17 and 57 light curves (blue and yellow dots, respectively) with the GP baseline model drawn as a black line. |
5. Conclusions
I have modelled the KELT-1b phase curves from TESS Sectors 17 and 57, separated by three years, showing that KELT-1b’s dayside brightness varies significantly between the two TESS Sectors. The difference can be best explained by a temporal albedo variability caused by changing silicate cloud coverage on the brown dwarf’s dayside since the two light curves were observed in the same passband. Weather is also the most likely explanation behind the discrepancies between the TESS and CHEOPS observations reported by Parviainen et al. (2022) as well as the Spitzer and TESS observations reported by Beatty et al. (2020) and von Essen et al. (2021).
The original dayside brightness estimates from the secondary eclipse observations by Beatty et al. (2014), Croll et al. (2015), and Beatty et al. (2017) were biased due to a strong stellar ellipsoidal variation signal that was not included into the eclipse models, but these biases were taken into account in the later studies.
Sector 57 would also have short-cadence photometry available, but a two-minute cadence is sufficient for the analysis presented here.
Stellar limb darkening was allowed to differ between the two TESS sectors to account for any possible limb darkening differences due to unocculted spots.
As in Parviainen et al. (2022), the flux ratio stands for the ratio of the radiation emitted towards the observer by the brown dwarf and the star per projected unit area. The flux ratio is not the ratio of the disk-integrated fluxes, but this can be obtained by multiplying the flux ratio by the companion-star area ratio, k2.
Acknowledgments
I thank the anonymous referee for their timely and helpful comments and the CHEOPS community for the valuable discussion. I acknowledge the support by the Spanish Ministry of Science and Innovation with the Ramon y Cajal fellowship number RYC2021-031798-I. I acknowledge the use of public TESS Alert data from pipelines at the TESS Science Office and at the TESS Science Processing Operations Center. Resources supporting this work were provided by the NASA High-End Computing (HEC) Program through the NASA Advanced Supercomputing (NAS) Division at Ames Research Center for the production of the SPOC data products.
References
- Beatty, T. G., Collins, K. A., Fortney, J., et al. 2014, AJ, 783, 112 [NASA ADS] [CrossRef] [Google Scholar]
- Beatty, T. G., Madhusudhan, N., Pogge, R., et al. 2017, AJ, 154, 242 [Google Scholar]
- Beatty, T. G., Marley, M. S., Gaudi, B. S., et al. 2019, AJ, 158, 166 [Google Scholar]
- Beatty, T. G., Wong, I., Fetherolf, T., et al. 2020, AJ, 160, 211 [Google Scholar]
- Croll, B., Albert, L., Jayawardhana, R., et al. 2015, ApJ, 802, 28 [Google Scholar]
- Foreman-Mackey, D., Agol, E., Ambikasaran, S., & Angus, R. 2017, AJ, 154, 220 [Google Scholar]
- Gao, P., & Powell, D. 2021, ApJ, 918, L7 [CrossRef] [Google Scholar]
- Jenkins, J. M., Twicken, J. D., McCauliff, S., et al. 2016, in Software and Cyberinfrastructure for Astronomy IV, eds. G. Chiozzi, & J. C. Guzman, 9913, 99133E [Google Scholar]
- Parviainen, H. 2018, Handbook of Exoplanets (Cham: Springer International Publishing), 1 [Google Scholar]
- Parviainen, H., Wilson, T. G., Lendl, M., et al. 2022, A&A, 668, A93 [NASA ADS] [CrossRef] [EDP Sciences] [Google Scholar]
- Ricker, G. R., Winn, J. N., Vanderspek, R., et al. 2014, J. Astron. Telesc. Instrum. Syst., 1 [Google Scholar]
- Siverd, R. J., Beatty, T. G., Pepper, J., et al. 2012, ApJ, 761, 123 [Google Scholar]
- Smith, J. C., Stumpe, M. C., Van Cleve, J. E., et al. 2012, PASP, 124, 1000 [Google Scholar]
- Stumpe, M. C., Smith, J. C., Van Cleve, J. E., et al. 2012, PASP, 124, 985 [Google Scholar]
- Stumpe, M. C., Smith, J. C., Catanzarite, J. H., et al. 2014, PASP, 126, 100 [Google Scholar]
- von Essen, C., Mallonn, M., Piette, A., et al. 2021, A&A, 648, A71 [NASA ADS] [CrossRef] [EDP Sciences] [Google Scholar]
All Tables
Priors and posteriors for the CELERITE Matern-3/2 term hyperparameters and the white noise standard deviation.
All Figures
|
Fig. 1. Dayside brown dwarf to star flux ratio posteriors measured from TESS Sector 17 photometry, CHEOPS secondary eclipse observations, and TESS Sector 57 photometry. The y-axis offsets represent the average time differences between the observation sets (one year between the TESS S. 17 and CHEOPS observations and two years between the CHEOPS and TESS S. 57 observations). |
| In the text | |
|
Fig. 2. TESS photometry from Sectors 17 and 57 with the posterior GP variability model removed, folded over the KELT-1b orbital phase and binned over 15 min as blue points (the error bars are smaller than the points) and the median posterior phase curve model (with uncertainties smaller than the line width). |
| In the text | |
|
Fig. 3. Folded TESS photometry from Sectors 17 and 57 centred around the eclipse and binned over 43 min (panel a), and with the stellar ellipsoidal variation and Doppler beaming signals removed to show only the phase curve signal from KELT-1b (panel b). |
| In the text | |
|
Fig. 4. TESS Sector 17 and 57 light curves (blue and yellow dots, respectively) with the GP baseline model drawn as a black line. |
| In the text | |
Current usage metrics show cumulative count of Article Views (full-text article views including HTML views, PDF and ePub downloads, according to the available data) and Abstracts Views on Vision4Press platform.
Data correspond to usage on the plateform after 2015. The current usage metrics is available 48-96 hours after online publication and is updated daily on week days.
Initial download of the metrics may take a while.