Fig. 1.
Download original image
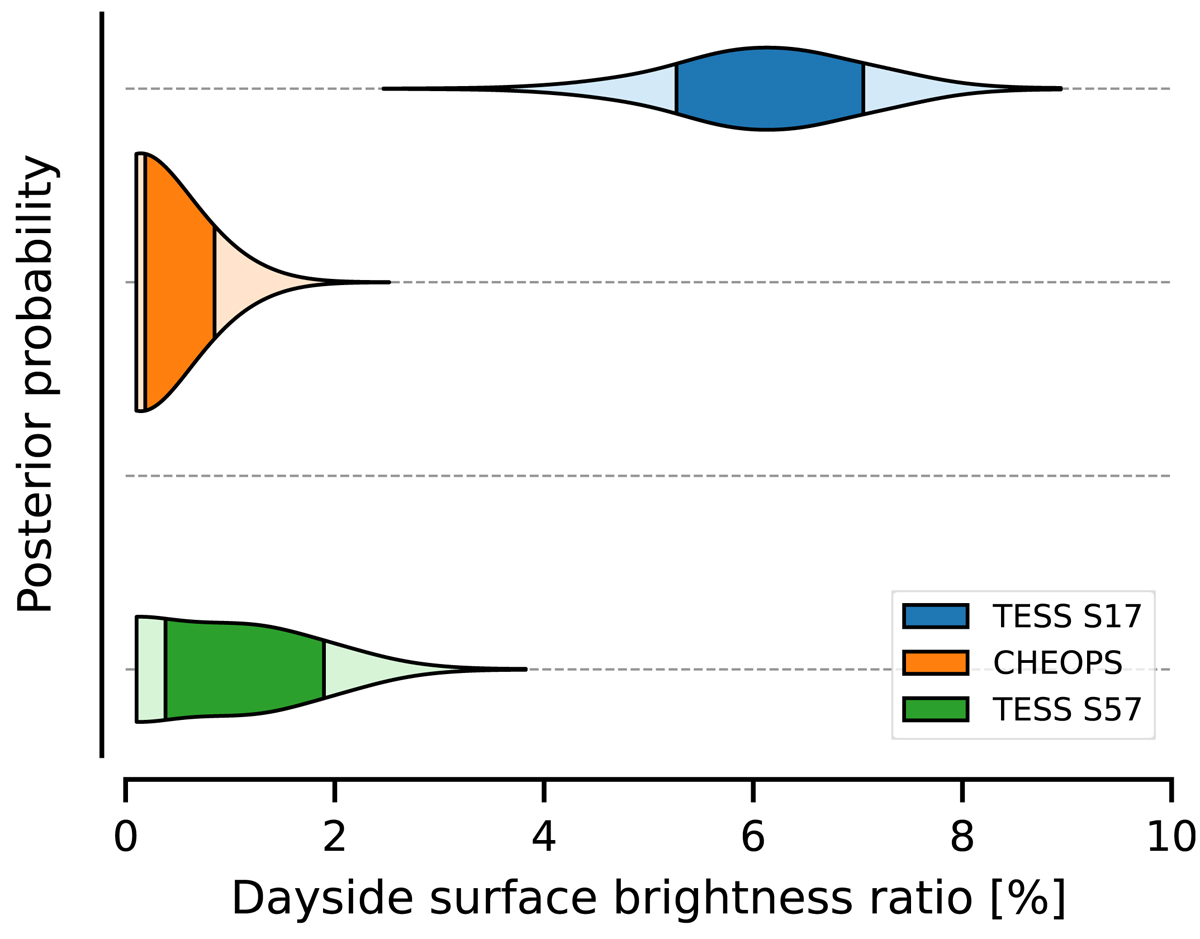
Dayside brown dwarf to star flux ratio posteriors measured from TESS Sector 17 photometry, CHEOPS secondary eclipse observations, and TESS Sector 57 photometry. The y-axis offsets represent the average time differences between the observation sets (one year between the TESS S. 17 and CHEOPS observations and two years between the CHEOPS and TESS S. 57 observations).
Current usage metrics show cumulative count of Article Views (full-text article views including HTML views, PDF and ePub downloads, according to the available data) and Abstracts Views on Vision4Press platform.
Data correspond to usage on the plateform after 2015. The current usage metrics is available 48-96 hours after online publication and is updated daily on week days.
Initial download of the metrics may take a while.