Fig. 5.
Download original image
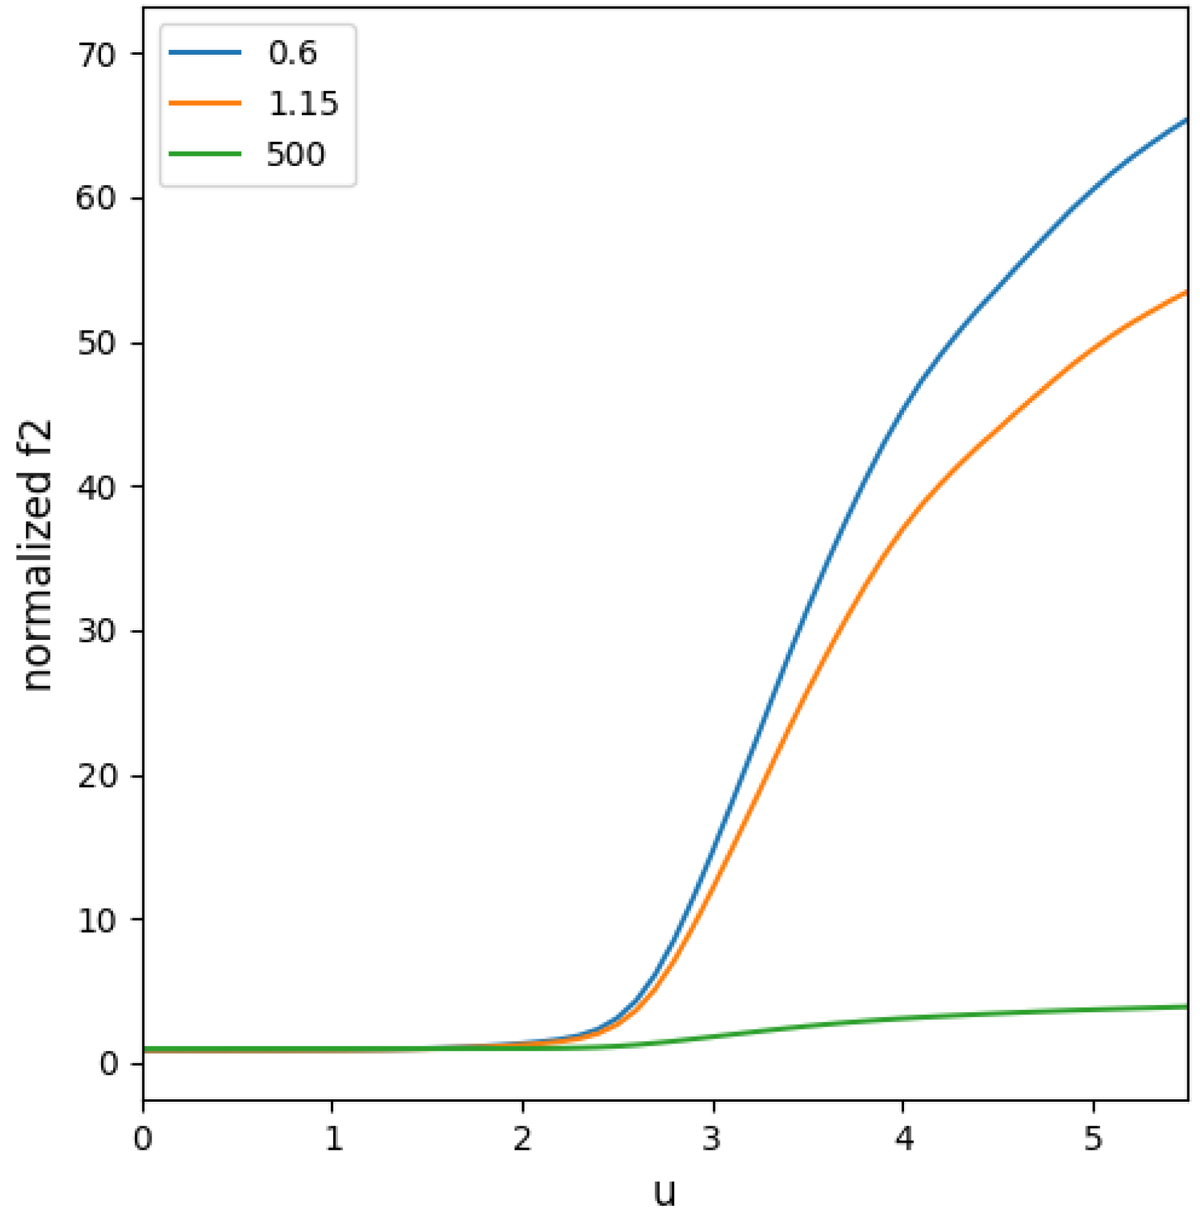
Deviations from Maxwellian illustrated by the changes of the normalized f2 at various optical depths (mentioned in the top-left frame) across an asymmetrically and strongly illuminated finite slab of total depth τ = 103. Largest amplitudes are for these two values around τ = 1, while smaller but significant deviations are still noticeable at midslab (τ = 500).
Current usage metrics show cumulative count of Article Views (full-text article views including HTML views, PDF and ePub downloads, according to the available data) and Abstracts Views on Vision4Press platform.
Data correspond to usage on the plateform after 2015. The current usage metrics is available 48-96 hours after online publication and is updated daily on week days.
Initial download of the metrics may take a while.