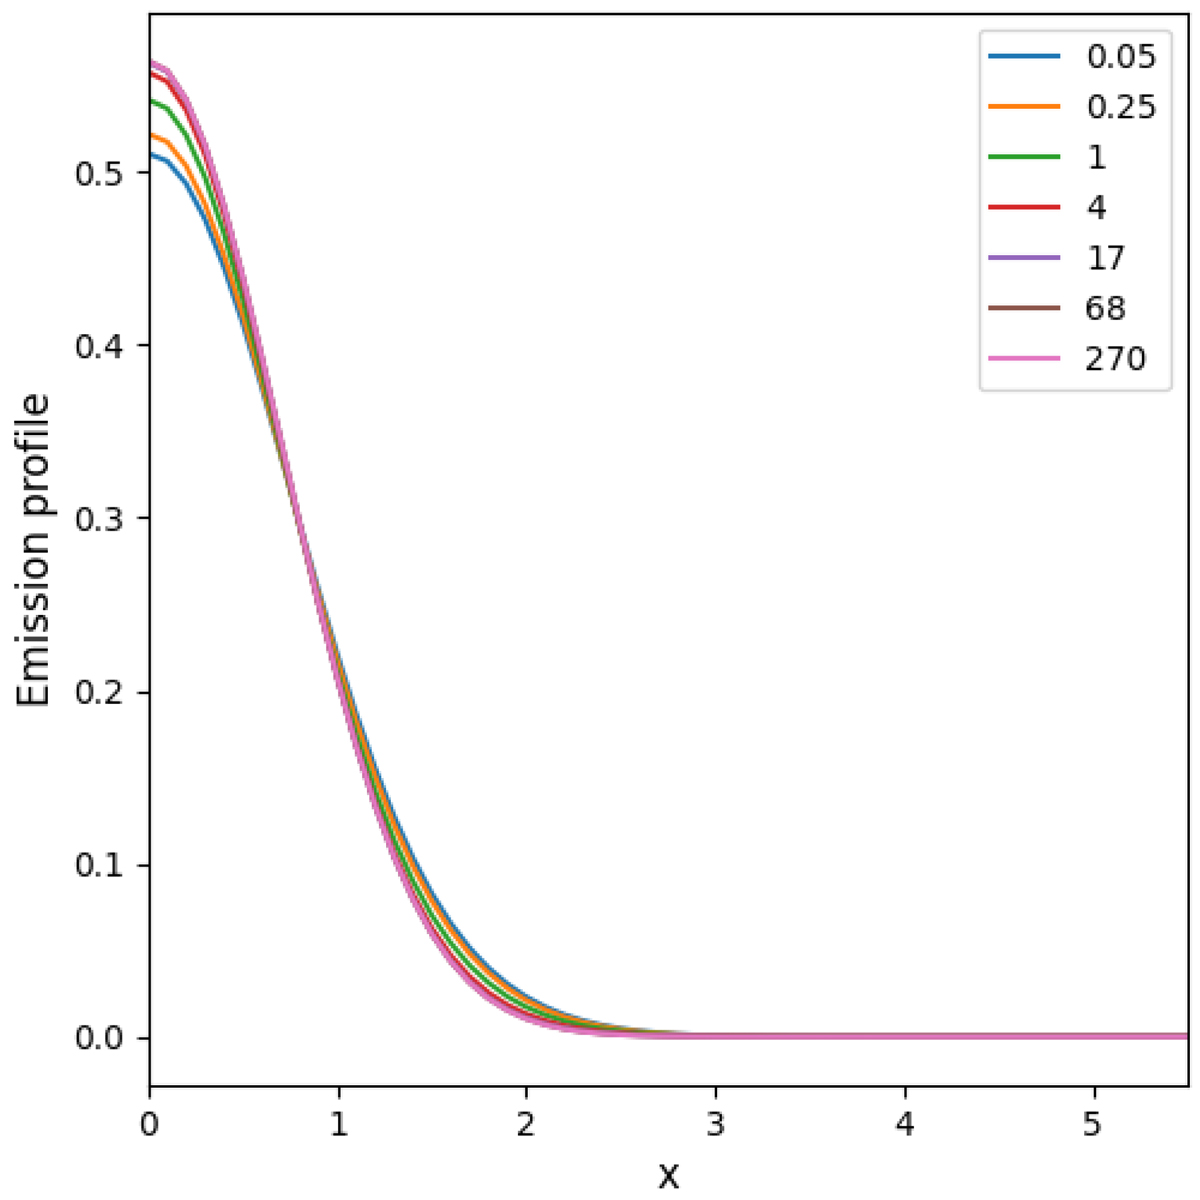
Fig. 2.
Download original image
Dependence of the emission profiles ψ(x, τ) on various optical depths across the atmosphere. Top-right frame gives the correspondence between τ at line center and the color of the relevant profile. The distribution is computed self-consistently with the radiation, without the need for any a priori given redistribution function.
Current usage metrics show cumulative count of Article Views (full-text article views including HTML views, PDF and ePub downloads, according to the available data) and Abstracts Views on Vision4Press platform.
Data correspond to usage on the plateform after 2015. The current usage metrics is available 48-96 hours after online publication and is updated daily on week days.
Initial download of the metrics may take a while.