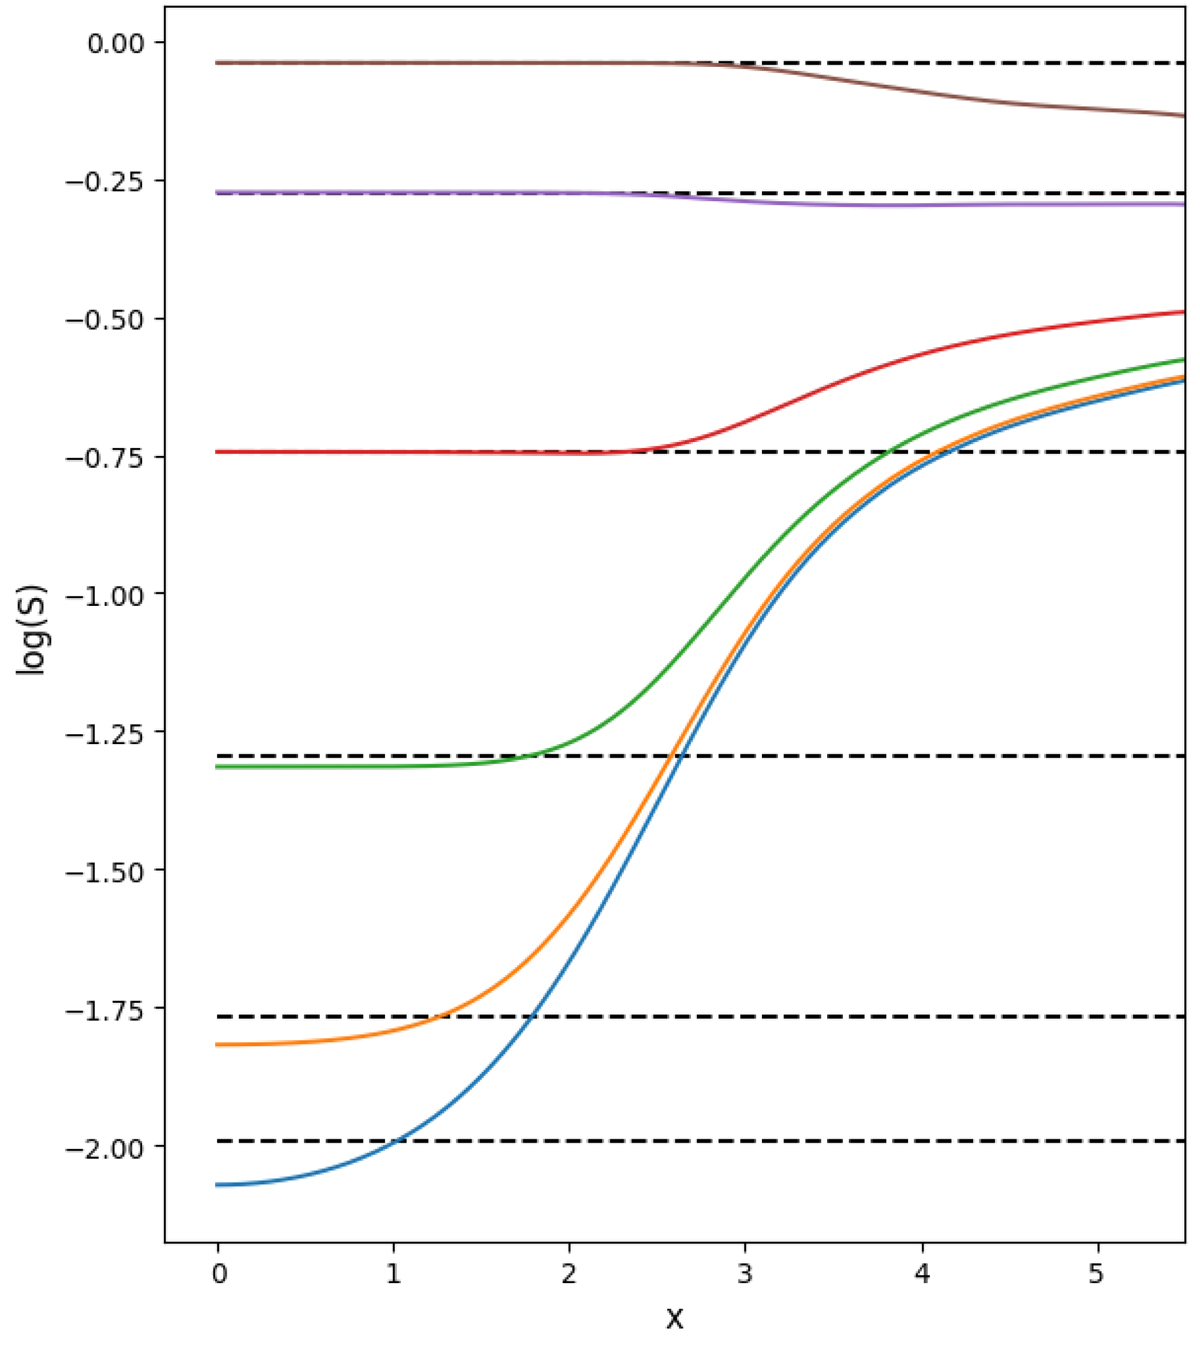
Fig. 1.
Download original image
Variation with frequency of the normalized source function, for different values of the optical depth at line center across the atmosphere. Dashed lines indicate the (constant with frequency) CRD values at τ = 0, 1, 10, 100, 103, 104 for comparison, where both SCRD and S(x = 0) increase with τ. It satisfactorily reproduces the standard PRD results using Hummer’s RI − A (see also Hummer 1969, Fig. 1c).
Current usage metrics show cumulative count of Article Views (full-text article views including HTML views, PDF and ePub downloads, according to the available data) and Abstracts Views on Vision4Press platform.
Data correspond to usage on the plateform after 2015. The current usage metrics is available 48-96 hours after online publication and is updated daily on week days.
Initial download of the metrics may take a while.