| Issue |
A&A
Volume 671, March 2023
|
|
|---|---|---|
| Article Number | L5 | |
| Number of page(s) | 11 | |
| Section | Letters to the Editor | |
| DOI | https://doi.org/10.1051/0004-6361/202244727 | |
| Published online | 02 March 2023 | |
Letter to the Editor
Direct discovery of the inner exoplanet in the HD 206893 system
Evidence for deuterium burning in a planetary-mass companion
1
University of Exeter, Physics Building, Stocker Road, Exeter EX4 4QL, UK
e-mail: This email address is being protected from spambots. You need JavaScript enabled to view it.
2
LESIA, Observatoire de Paris, Université PSL, CNRS, Sorbonne Université, Université Paris Cité, 5 Place Jules Janssen, 92195 Meudon, France
3
European Southern Observatory, Karl-Schwarzschild-Straße 2, 85748 Garching, Germany
4
Fakultät für Physik, Universität Duisburg-Essen, Lotharstraße 1, 47057 Duisburg, Germany
5
Institüt für Astronomie und Astrophysik, Universität Tübingen, Auf der Morgenstelle 10, 72076 Tübingen, Germany
6
Center for Space and Habitability, Universität Bern, Gesellschaftsstrasse 6, 3012 Bern, Switzerland
7
Max-Planck-Institut für Astronomie, Königstuhl 17, 69117 Heidelberg, Germany
8
Université Grenoble Alpes, CNRS, IPAG, 38000 Grenoble, France
9
Center for Interdisciplinary Exploration and Research in Astrophysics (CIERA) and Department of Physics and Astronomy, Northwestern University, Evanston, IL 60208, USA
10
Department of Astronomy, California Institute of Technology, Pasadena, CA 91125, USA
11
Space Telescope Science Institute, Baltimore, MD 21218, USA
12
Institute of Astronomy, University of Cambridge, Madingley Road, Cambridge CB3 0HA, UK
13
Center for Astrophysics and Planetary Science, Department of Astronomy, Cornell University, Ithaca, NY 14853, USA
14
Department of Physics & Astronomy, Johns Hopkins University, 3400 N. Charles Street, Baltimore, MD 21218, USA
15
Leiden Observatory, Leiden University, PO Box 9513 2300 RA Leiden, The Netherlands
16
Department of Physics, University of Warwick, Coventry CV4 7AL, UK
17
Universidade de Lisboa – Faculdade de Ciências, Campo Grande, 1749-016 Lisboa, Portugal
18
CENTRA – Centro de Astrofísica e Gravitação, IST, Universidade de Lisboa, 1049-001 Lisboa, Portugal
19
Max Planck Institute for Extraterrestrial Physics, Giessenbachstraße 1, 85748 Garching, Germany
20
Aix Marseille Univ., CNRS, CNES, LAM, Marseille, France
21
School of Physics and Astronomy, Monash University, Clayton, Melbourne, 3800 VIC, Australia
22
Institute of Physics, University of Cologne, Zülpicher Straße 77, 50937 Cologne, Germany
23
Max Planck Institute for Radio Astronomy, Auf dem Hügel 69, 53121 Bonn, Germany
24
Universidade do Porto, Faculdade de Engenharia, Rua Dr. Roberto Frias, 4200-465 Porto, Portugal
25
School of Physics, University College Dublin, Belfield, Dublin 4, Ireland
26
Astronomy Department, University of Michigan, Ann Arbor, MI 48109, USA
27
European Southern Observatory, Casilla, 19001 Santiago 19, Chile
28
European Space Agency (ESA), ESA Office, Space Telescope Science Institute, 3700 San Martin Drive, Baltimore, MD 21218, USA
29
Department of Earth & Planetary Sciences, Johns Hopkins University, Baltimore, MD, USA
30
Department of Astronomy, Smith College, Northampton, MA 01063, USA
31
Pixyl S.A., 5 Av. du Grand Sablon, 38700 La Tronche, France
32
Department of Physics, University of Oxford, Oxford, UK
33
Department of Physics and McGill Space Institute, McGill University, 3600 Rue University, Montreal, QC H3A 2T8, Canada
34
Institut de Recherche sur les Exoplanètes (iREx), Université de Montréal, C.P. 6128 Succ. Centre-ville, Montreal, QC H3C 3J7, Canada
35
Academia Sinica, Institute of Astronomy and Astrophysics, 11F Astronomy-Mathematics Building, NTU/AS campus, No. 1, Section 4, Roosevelt Rd., Taipei 10617, Taiwan
36
Advanced Concepts Team, European Space Agency, TEC-SF, ESTEC, Keplerlaan 1, 2201 AZ Noordwijk, The Netherlands
Received:
9
August
2022
Accepted:
25
October
2022
Abstract
Aims. HD 206893 is a nearby debris disk star that hosts a previously identified brown dwarf companion with an orbital separation of ∼10 au. Long-term precise radial velocity (RV) monitoring, as well as anomalies in the system proper motion, has suggested the presence of an additional, inner companion in the system.
Methods. Using information from ongoing precision RV measurements with the HARPS spectrograph, as well as Gaia host star astrometry, we have undertaken a multi-epoch search for the purported additional planet using the VLTI/GRAVITY instrument.
Results. We report a high-significance detection over three epochs of the companion HD 206893c, which shows clear evidence for Keplerian orbital motion. Our astrometry with ∼50−100 μarcsec precision afforded by GRAVITY allows us to derive a dynamical mass of 12.7 MJup and an orbital separation of 3.53
 au for HD 206893c. Our fits to the orbits of both companions in the system use both Gaia astrometry and RVs to also provide a precise dynamical estimate of the previously uncertain mass of the B component, and therefore allow us to derive an age of 155 ± 15 Myr for the system. We find that theoretical atmospheric and evolutionary models that incorporate deuterium burning for HD 206893c, parameterized by cloudy atmosphere models as well as a “hybrid sequence” (encompassing a transition from cloudy to cloud-free), provide a good simultaneous fit to the luminosity of both HD 206893B and c. Thus, accounting for both deuterium burning and clouds is crucial to understanding the luminosity evolution of HD 206893c.
Conclusions. In addition to using long-term RV information, this effort is an early example of a direct imaging discovery of a bona fide exoplanet that was guided in part by Gaia astrometry. Utilizing Gaia astrometry is expected to be one of the primary techniques going forward for identifying and characterizing additional directly imaged planets. In addition, HD 206893c is an example of an object narrowly straddling the deuterium-burning limit but unambiguously undergoing deuterium burning. Additional discoveries like this may therefore help clarify the discrimination between a brown dwarf and an extrasolar planet. Lastly, this discovery is another example of the power of optical interferometry to directly detect and characterize extrasolar planets where they form, at ice-line orbital separations of 2−4 au.
Key words: planets and satellites: detection / instrumentation: high angular resolution / instrumentation: interferometers / techniques: high angular resolution / techniques: interferometric / infrared: planetary systems
© The Authors 2023
 Open Access article, published by EDP Sciences, under the terms of the Creative Commons Attribution License (https://creativecommons.org/licenses/by/4.0), which permits unrestricted use, distribution, and reproduction in any medium, provided the original work is properly cited.
This article is published in open access under the Subscribe to Open model. This email address is being protected from spambots. You need JavaScript enabled to view it. to support open access publication.
1. Introduction
What distinguishes an extrasolar giant planet (EGP) from a brown dwarf (BD) is still a matter of debate. The current IAU definition of a planet is an object that is below the mass required for thermonuclear fusion of deuterium, which we currently believe occurs at 13 Jupiter masses. Identifying objects near this mass limit will clarify how distinct the boundary between massive planets and BDs really is (e.g., Mollière & Mordasini 2012; Bodenheimer et al. 2013). However, what qualifies an object as an exoplanet may also be related to its formation mechanism rather than solely its mass (e.g., Chabrier et al. 2007). Hybrid exoplanetary systems that contain both a BD and an exoplanet, which presumably formed at the same time from the same protoplanetary disk, are therefore ideal systems for studying different possible formation pathways using diagnostics such as atmospheric atomic ratios (e.g., Öberg et al. 2011; Madhusudhan et al. 2014; Mordasini et al. 2016; Mollière et al. 2022) and initial entropy (e.g., Spiegel & Burrows 2012; Marleau & Cumming 2014). Finding and characterizing planetary mass companions near this deuterium-burning limit (e.g., Bowler et al. 2013; Bonnefoy et al. 2014; Hinkley et al. 2013), or systems that contain both a BD and an exoplanet, will allow us to clarify how we draw a distinction between these two classes of objects (e.g., Mollière & Mordasini 2012).
HD 206893 is a nearby (40.707 ± 0.067 pc; Gaia Collaboration 2018) F5V star with a roughly solar metallicity that ranges from [Fe/H] = −0.07 to −0.05 (Holmberg et al. 2007; Gáspár et al. 2016) to +0.01 (Netopil 2017) and a highly uncertain age due to the lack of clear membership to any young kinematic moving groups. Most age estimates of this star have been in the range 100−300 Myr (Zuckerman & Song 2004; Delorme et al. 2017; Milli et al. 2017; Kammerer et al. 2021). However, some works have allowed ages as young as 3 or 50 Myr (Kammerer et al. 2021; Ward-Duong et al. 2021), while another has quoted an age as high as 2.1 Gyr (e.g., David & Hillenbrand 2015). A substellar companion, HD 206893B, was first identified in Milli et al. (2017), who determined a projected orbital separation of ∼10 au using the VLT SPHERE instrument. The somewhat uncertain system age, as well as an unconstrained astrometric orbit, allowed only loose constraints to be placed on the mass of HD 206893B, initially placing it in the range 24−73 MJup (Milli et al. 2017). However, this was later refined to be between ∼5 MJup (Kammerer et al. 2021) and 30−40 MJup (Delorme et al. 2017; Kammerer et al. 2021; Ward-Duong et al. 2021). This object possesses extraordinarily red infrared colors and has been characterized in numerous subsequent works (Delorme et al. 2017; Stolker et al. 2020; Meshkat et al. 2021; Ward-Duong et al. 2021; Kammerer et al. 2021).
Evidence for an additional, inner companion in the system has been emerging. Using precise radial velocity (RV) monitoring with the High Accuracy Radial velocity Planet Searcher (HARPS) spectrograph over 1.6 yr, Grandjean et al. (2019a) revealed a significant RV drift that cannot be solely due to HD 206893B, and hypothesized the presence of a ∼15 MJup companion. Similarly, Kammerer et al. (2021) showed that the anomaly in the Gaia Early Data Release 3 (EDR3) proper motion cannot be explained by the B companion alone. They constrained the parameter space spanned by the mass and the on-sky position of an additional, hypothesized 8−15 MJup companion.
In this Letter, using optical interferometry over several epochs, we present the discovery of HD 206893c, a ∼12−13 MJup exoplanet orbiting the star at 3.5 au. Our study marks the first direct detection of HD 206893c, providing highly precise astrometry (∼50−100 μarcsec) of the HD 206893c orbit, as well as medium resolution (R ∼ 500) spectroscopy in the K band.
In addition to obtaining a precise dynamical mass for the HD 206893c exoplanet, our study also provides precise astrometry of the orbit of HD 206893B. This increased precision on the HD 206893B orbit, combined with its very well-constrained luminosity, allows us to derive a well-constrained system age of 155 ± 15 Myr. This discovery of HD 206893c establishes HD 206893 as a hybrid planetary system that hosts both an exoplanet and a BD, and therefore presents itself as a valuable laboratory for studying possible formation pathways of EGPs and BDs.
2. Observations
2.1. Precision radial velocities
As described in Grandjean et al. (2019a), HD 206893 has been monitored for several years, since 2016, with HARPS (La Silla, ESO) as part of the Young Nearby Stars (YNS) survey (Lagrange et al. 2013). The Spectroscopic data via Analysis of the Fourier Interspectrum RVs (SAFIR) software (Galland et al. 2005) was used to compute the RV signal. Figure 1 (left panel) shows the processed historical RV data sets taken from Grandjean et al. (2019a) that were used in this study to predict the semimajor axis of HD 206893c. The residuals between the RV data points and the posterior curves shown in the figure are likely due to stellar pulsations. As shown in Table A.1, there is an additional σRV = 40 m s−1 amplitude best-fit stellar jitter term not currently represented in the uncertainties on the individual RV points shown in Fig. 1. However, as discussed in Sect. 3.1, such residuals in the RV data will not have a significant impact on the final derived physical parameters for HD 206893c.
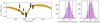 |
Fig. 1. Left: RVs and proper motion anomaly: HARPS RVs for HD 206893 (e.g., Grandjean et al. 2019a) along with samples from the posterior for the model fit to the RVs and proper motion anomalies. Right: posterior distributions for our best-fit model of the predicted proper motion anomaly (purple histograms), calculated as the difference between the Gaia EDR3 proper motion, and the long-term proper motion, calculated by comparing Gaia and HIPPARCOS data (labelled “HG” in the figure) and displayed individually in terms of right ascension and declination. The vertical blue lines show the actual values, with 1σ uncertainties represented by the dashed lines. |
2.2. GRAVITY observations and data processing
All the GRAVITY observations presented in this Letter were acquired using the dual-field, on-axis mode, with medium spectral resolution (R = 500). We closely followed the observing strategy outlined in GRAVITY Collaboration (2019), where the science fiber is alternately centered on the star, to obtain the phase reference, and on the position of HD 206893c. These observations were reduced using the procedure described in GRAVITY Collaboration (2020) and Nowak et al. (2020). The coherent flux was extracted for the on-star and on-planet exposures using the GRAVITY pipeline (Lapeyrere et al. 2014). The on-planet data were then phase-referenced to the on-star observations, and the data were fitted with a model that includes both a planet component and a low-order polynomial (for speckle deconvolution). The astrometry was obtained by varying the astrometry of the planet component and looking for the minimum χ2 or, equivalently, by maximizing the periodogram power. More details are provided in Sect. 2.3 and Appendix B of Nowak et al. (2020).
Following the work from Kammerer et al. (2021), we used the previous GRAVITY astrometry of HD 206893B in combination with the new HARPS observations (Grandjean et al. 2019a,b) and Gaia Data Release 3 astrometry (Gaia Collaboration 2016, 2021) to predict a position for HD 206893c in August 2021. We used the proper motion anomaly calculated as the difference between the Gaia EDR3 proper motion and the long-term proper motion as calculated by comparing Gaia with HIPPARCOS proper motions (labelled “HG” in Fig. 1). The previous GRAVITY astrometry measurements were particularly useful for constraining the orbit of HD 206893B and subsequently removing its signal from the RV data and Gaia astrometry. The RV data allowed us to constrain the period, and thus the semimajor axis, of HD 206893c, while the Gaia astrometry provided constraints on its position angle.
On the nights of 27 and 28 August, we used the VLTI/GRAVITY instrument (GRAVITY Collaboration 2017) to try to detect the exoplanet. GRAVITY only probes a small circular region of ∼50 mas radius around the position of the single-mode fiber. We searched for the companion over a region on the order of 10 000 mas2 by offsetting the science fiber of the instrument. At the same time the fringe tracker observed the star to correct atmospheric turbulence (Lacour et al. 2019). This allowed an integration time of several tens of seconds. The log of the observations, as well as the position of the single-mode fibers, is summarized in Table 1. On the second night, on the last pointing, a weak signal was detected.
Observing log of the four nights.
The exoplanet position was confirmed one month later, in September. A clear detection was obtained during run ID 1104.C-0651, part of the ExoGRAVITY large program (Lacour et al. 2020), and confirmed during a dedicated run (ID 105.20T0.001). In October, a final observation was carried out, as part of the ExoGRAVITY large program, with the goal of obtaining a good calibration of the spectrum. Figure 2 provides examples of the periodogram power maps obtained from our observations, both for a non-detection (fiber mispointed during the search) and for a detection of the planet.
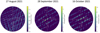 |
Fig. 2. Periodogram power maps, similar to the one presented in Nowak et al. (2020), obtained for three different observations of HD 206893c: one resulting in a non-detection during the search for the planet (in August 2021) and two clear detections in September and October 2021. |
The K-band contrast relative to the host star for HD 206893c is approximately 8.2×10⁻⁵, compared to 1.6×10⁻⁴ for HD 206893B. The reliability of this contrast ratio is ensured since the host star was observed simultaneously using the GRAVITY fringe tracker, so the ratio of coherent energy was constantly monitored and was the result of a simultaneous measurement. The main systematic uncertainty that can arise in this measurement is due to the response of the injection of the signal into the fiber, defined by the “lobe” of the interferometer, which can be computed analytically as described in Appendix A of Wang et al. (2021). Previous calibrations revealed these systematics to be small.
The astrometry obtained at the three epochs is given in Table 2. In addition to HD 206893c, we recomputed the astrometry of HD 206893B from Kammerer et al. (2021) and added an additional position obtained in August 2021. With respect to the theoretical performance of GRAVITY (10 μas; Lacour et al. 2014), the astrometry accuracy is still a factor of 5 to 20 worse. The difference on the night of 27 August can be explained by the mispointing of the science fiber during the search for the exoplanet. The error bars still do not decrease considerably during the other runs because of the limitation due to systematics, particularly the optical aberrations within the fiber injection optics (GRAVITY Collaboration 2021).
GRAVITY astrometry of HD 206893B and HD 206893c.
2.3. Statistical significance of the detection
In Fig. 2 we show an example of the periodogram power maps for three observations of HD 206893c: one in August 2021, obtained when the fiber was mispointed during the search, and two obtained in September and October 2021, when the fiber was properly centered on the planet. Each of the three maps represents the field of view of the GRAVITY science fiber. A clear peak with some sidelobes in the periodogram power (not visible in the August 2021 observation) are characteristic of a successful detection and give the position of the planet.
3. Results
3.1. Orbital fits
To assess the orbital parameters for HD 206893B and c, we employed the method presented in Lacour et al. (2021) to perform Bayesian parameter estimation with the orbitize! software package (Blunt et al. 2020). We jointly fit the orbits of multiple substellar companions using relative astrometry from GRAVITY, the stellar RVs described in the previous section, and HIPPARCOS and Gaia absolute stellar astrometry from the EDR3 edition of the HIPPARCOSGaia Catalog of Accelerations (HGCA) (Brandt 2021; Kervella et al. 2022). This method accounts for shifts in the system barycenter due to multiple planets in the system, but does not account for planet–planet interactions, which are negligible on these timescales. The covariances of the uncertainties in RA–Dec due to u − v coverage are also automatically handled by orbitize!. To find the best-fit orbits for the HD 206893B and c objects, the parallel-tempered affine-invariant sampler (Foreman-Mackey et al. 2013; Vousden et al. 2016) was run using 20 temperatures, 1000 walkers per temperature, and 60 000 steps per walker. The walker chains were visually inspected for convergence, and the last 10 000 steps from each walker at the lowest temperature were used to form the posterior distributions for each parameter.
The results of our Markov chain Monte Carlo orbital fits are summarized in Table 3, and a depiction of the orbits for both HD 206893B and c are shown in Fig. 3. The best estimate of the mass and semimajor axis of HD 206893c is 12.7 MJup and 3.53
 au (∼5.7 yr orbital period) for a dynamical fit that incorporates the precise RV monitoring from HARPS. Excluding the RV information from the fit results in values of 11.5
 MJup and 3.68
 au. These values are largely consistent with, but also significantly more precise than, the previous estimations of these parameters for the hypothesized HD 206983c companion of 8-15 MJup and ≲5.6 au (Grandjean et al. 2019a; Kammerer et al. 2021). At the same time, our fits reveal a precise and significantly nonzero eccentricity,
  , for HD 206893c (
 when excluding the RV measurements). For completeness, we also summarize the results of our orbital fit for HD 206893B. We find a mass and semimajor axis of
  MJup and
  au, corresponding to a ∼26 yr orbital period (26.2
 MJup and 9.7
 au when excluding the RV measurements). More details on the orbit fitting, including the orbital alignment parameters (e.g., i, ω, and Ω) can be found in Appendix A. Similar to the case for HD 206893c, the mass determination for HD 206893B is consistent with, but also significantly more precise than, previous estimates (e.g., Grandjean et al. 2019a; Meshkat et al. 2021; Ward-Duong et al. 2021; Kammerer et al. 2021) that quoted a mass of 5–30 MJup, and clearly places HD 206893B in the low-mass BD regime.
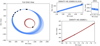 |
Fig. 3. Diagram showing the class of orbits consistent with the measured astrometry for HD 206893B (blue orbits) and HD 206893c (red orbits). The HD 206893B astrometry comes from astrometry obtained in Milli et al. (2017), Delorme et al. (2017), Grandjean et al. (2019a), Stolker et al. (2020), and Ward-Duong et al. (2021), as well as the recent GRAVITY detections. The right panels are magnifications (50−100x) of portions of the orbits, highlighting the ∼50−100 microarcsecond astrometric precision. |
Orbital and physical parameters for HD 206893c and re-evaluated parameters of HD 206893B.
3.2. GRAVITY spectroscopy of HD 206893c: Model grid fits to derive atmospheric parameters
Figure 4 shows our collected spectrophotometry for both HD 206893B and c. We estimated the primary atmospheric parameters of HD 206893c (i.e., effective temperature, surface gravity, and metallicity) with the methodology outlined in Kammerer et al. (2021). We fit the GRAVITY spectroscopy shown in Fig. 4 with a grid of DRIFT-PHOENIX models (Helling et al. 2008) using the species toolkit (Stolker et al. 2020). We chose these models to fit the spectroscopy of HD 206893c for simplicity, as well as to be consistent with the fits carried out in Kammerer et al. (2021) for the HD 206893B companion. Moreover, of the three different model grids used in Kammerer et al. (2021), the DRIFT-PHOENIX grid is the only one that yields a good fit to the extremely red colors of HD 206893B without requiring an additional source of reddening. Even if the DRIFT-PHOENIX grid does not fully capture the full physical picture of the atmosphere, the models fit empirically well and thus are effective for measuring the bolometric luminosity. We defer a more in-depth characterization of the atmosphere of HD 206893c, involving a larger class of models, to a future work.
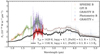 |
Fig. 4. Combined R ∼ 500 GRAVITY K-band spectra of HD 206893c and B (red and light purple, respectively) together with the best-fit DRIFT-PHOENIX models (black and light brown). Shown in light orange, green, and blue is archival spectrophotometry of B that was also included in the fit. For the model spectra, several samples drawn from the posterior distribution are shown with thin lines. |
The best-fit parameters for HD 206893B and c are shown in Table 3. The best-fit DRIFT-PHOENIX spectra together with our GRAVITY spectra of both companions, as well as other spectrophotometry of B from the literature, are shown in Fig. 4. We highlight the bolometric luminosities log(L/L⊙) = − 4.23 ± 0.01 dex and  calculated from the best-fit models for HD 206893B and c, respectively. We also find a best-fit metallicity
 ![Mathematical equation: $ \mathrm{[Fe/H]} = 0.27^{+0.02}_{-0.05} $](/articles/aa/full_html/2023/03/aa44727-22/aa44727-22-eq38.gif) and
and  for B and c, respectively, which is notably different from the nearly solar metallicity of the host star ([Fe/H] = 0.04 ± 0.02; Kammerer et al. 2021). However, for the purposes of this Letter, the metallicity of the atmospheric model has a negligible effect on the final calculated bolometric luminosity, Lbol. Specifically, when the fit is restricted to solar-metallicity models ([Fe/H] = 0.0), the bolometric luminosity of the best-fit model is negligibly smaller (by only 0.02 dex, or 5%). A similar difference is seen for HD 206893B, in which the luminosity determined from solar-metallicity models would be log(L/L⊙) = − 4.20 dex, only 0.03 dex higher than the value in Table 3.
Our bolometric luminosity for HD 206893c was calculated by integrating a model that is fit only to the GRAVITY K-band spectrum at ∼2 μm since there are no photometric measurements at other wavelengths. To test the reliability of this Lbol estimate, we calculated the bolometric luminosity for HD 206893B from a fit only to its K-band spectrum from GRAVITY, ignoring the other available data. This yields log(L/L⊙) = − 4.26 ± 0.01, only ≲7% smaller than the −4.23 ± 0.01 value from the best fit to all of the spectrophotometric data at 1−5 μm. Under the assumption that the spectral shapes of the two objects are similar, this suggests that our bolometric luminosity determination for HD 206893c is robust.
The derived bolometric luminosity depends to some extent on the chosen atmospheric model. Therefore, there may be additional systematic uncertainties due to these differences between models. To estimate these systematics, we fit an ensemble of five additional theoretical atmosphere models (i.e., AMES-Dusty, BT-Settl, Exo-REM, and petitCODE, as well as a simple blackbody curve) to the K-band GRAVITY spectrum of HD 206893c. As expected, the quality of each fit varied from model to model, and each fit returned a slightly different value for the bolometric luminosity. The rough overall standard deviation in log(L/L⊙) is 0.20 dex. Thus, for the analysis in this Letter, going forward we adopted a value of log(L/L⊙) = − 4.42 ± 0.20 for HD 206893c, which should account for systematic uncertainties between models. Some of the returned radii are clearly lower than expected (albeit not pathologically so), but these deviations are accounted for in our presented uncertainty. We discuss the physical implications of this expanded uncertainty more in Sect. 4.
For the atmospheric model fitting, letting the mass of c be entirely free leads to a clearly incorrect estimation of the mass, with the best-fit surface gravity log g and R implying Mc ∼ 100 MJup. Therefore, we used the dynamical mass (12.7 MJup; Table 3) as a prior, and obtain 9.9
 MJup, roughly 20% smaller than the prior. Nevertheless, the dynamical mass should be treated as much more reliable. For the other atmospheric parameters (R, Teff, log g), we find a similar level of variation, of 10−20%, in the values across the models. Nonetheless, the DRIFT-PHOENIX models are the most consistent with the previous model fitting in Kammerer et al. (2021), and so we report their values in Table 3.
3.3. Constraints on the system age and on the cloudiness of HD 206893c
The dynamical mass determination of HD 206893B, precise to 10%, can be combined with the object’s bolometric luminosity to derive an age for the system by using cooling tracks. At constant age, the luminosity of hot-start gas giants scales roughly as Lbol ∼ M2 at intermediate luminosities (Arras & Bildsten 2006; Marleau & Cumming 2014), so the mass ratio MB/Mc ≈ 2 would naively imply a luminosity difference of log(LB/Lc)≈0.6 dex. However, the luminosities of HD 206893B and c differ by only 0.2 dex.
Adjusting the initial entropy (Spiegel & Burrows 2012; Marleau & Cumming 2014) of either object does not bring their current luminosities closer. Indeed, an elevated initial entropy will not increase the luminosity of c at its present age because hot starts already assume an initial cooling timescale that is much shorter than the current age (Marleau & Cumming 2014). Similarly, no reasonable lower initial entropy for B could sufficiently delay the beginning of deuterium burning such that it would be observed in the rising part of a “deuterium flash” (see Fig. 8 of Marleau & Cumming 2014 or Fig. 13 of Bonnefoy et al. 2014). Given that the mass of HD 206893c is close to the deuterium-burning limit M ≈ 11.5 − 14.5 MJup (Spiegel et al. 2011; Mollière & Mordasini 2012), nuclear reactions are a likely candidate for bringing the luminosity of HD 206893c closer to that of B, as are clouds, which may play a role in the L–T transition that low-mass objects experience (Dupuy & Liu 2012; Liu et al. 2016). Coincidentally, both can occur at similar effective temperatures (Saumon & Marley 2008), depending on the mass of the object.
Therefore, we turned to the models of Saumon & Marley (2008, hereafter SM08). The SM08 models provide luminosities and magnitudes for objects cooling with a cloudy or a clear (cloud-free) atmosphere at all ages, which they show is very similar to, respectively, COND03 (Baraffe et al. 2003) or DUSTY00 (Chabrier et al. 2000). The cloudiness of the atmosphere influences the cooling rate and thus the luminosity and radius evolution of low-mass objects. The advantage of the SM08 models is that they also provide a “hybrid sequence”, using a transition from cloudy at high effective temperature Teff ≥ 1400 K to cloud-free at lower Teff ≤ 1200 K. This is a simplified model of the L–T transition but has the potential of delaying the cooling differently for HD 206893B and c. Despite the numerous improvements in opacities since (Saumon & Marley 2008), the recent cloud-free Sonora models (Marley et al. 2021) have very similar isochrones to SM08 or COND03. Given this, and since cloudy Sonora models are not yet available, the SM08 models are a good modeling choice and continue to be used to model substellar objects (e.g., VHS J1256–1257AB b; Dupuy et al. 2023).
In Fig. 5 (left panel) we show isochrones for the three varieties of SM08 models: clear (190 Myr), cloudy (155 Myr), and hybrid (155 Myr). They all pass through the well-constrained luminosity of B at its dynamical mass, allowing for relatively tight constraints to be placed on the age of the system. A more careful statistical assessment is planned for future work, but isochrones at 155 ± 15 Myr (155 ± 20 Myr) for hybrid (cloudy) models pass within one mass error bar of HD 206893B. Figure 5 shows the important finding that both the cloudy and the hybrid models are able to fit both objects, but that the clear models of SM08 are somewhat inconsistent (to about one sigma) with the luminosity of c. This also applies to the COND03 models, which would require an age of 195 Myr, as we verified separately. The 140−170 Myr isochrones that pass through one mass standard deviation of HD 206893B are also easily consistent with the luminosity of HD 206893c (not shown).
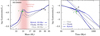 |
Fig. 5. Isochrones and cooling curves for both HD 206893B and c. Left: isochrones from Saumon & Marley (2008) that match the dynamical mass and bolometric luminosity of HD 206893B, with the respective age indicated in the legend. The deuterium-burning mass limit, which depends on bulk planetary properties, is shown as a fuzzy pink region (Spiegel et al. 2011). Right: corresponding cooling curves for the best-fit masses. The system age of 155 ± 15 Myr comes from our isochrone analysis (see text). The thick part of the hybrid cooling curves highlights 1400 K > Teff > 1200 K, with cloudy (clear) atmospheres at earlier (later) times. |
Figure 5 also displays cooling curves for the three SM08-family models, using the best-fit masses. When using clear atmospheres, the cooling curves of HD 206893c are somewhat underluminous, but are overluminous for HD 206893B. Deuterium burning barely plays a role near the current age of the higher-mass object, the nuclear fuel being instead spent at an earlier age, ∼10 Myr (e.g., Burrows et al. 2001). Cloudy atmospheres, whether assumed to be present at all times or only down to Teff = 1400 K (hybrid sequence), change the relative cooling so as to “pinch” the cooling curves together.
Interestingly, according to the hybrid model of SM08, HD 206893c might be in the process of losing its clouds, but its luminosity would be the same as an object that is still cloudy. Also, for HD 206893B, the transition from a cloudy to a clear atmosphere would only significantly change the luminosity compared to a pure cloudy cooling sequence at later ages, t ≳ 500 Myr.
4. Discussion
The highly precise astrometry delivered by GRAVITY (∼50−100 μarcsec) let us derive dynamical masses for the objects in the HD 206893 system that are precise at the level of 5−10%. Continued astrometric monitoring of both objects could, of course, lead to tighter constraints on the derived dynamical masses, and thus yield a more precise age determination. In combination with SM08 models, the masses and luminosities reveal that both cloudy models and hybrid cloudy models featuring a cloudy-to-clear transition describe the cooling of both objects well, and that a clear atmosphere for both objects is not consistent with the observations.
Thus, the bolometric luminosities, independently of spectroscopy, already disfavour the scenario in which both companions have cooled with a clear atmosphere up to now. However, while a 140-Myr SM08 clear isochrone is overluminous at the mass of HD 206893B, it does match the luminosity of HD 206893c. Thus, both objects could have different degrees of cloudiness.
It is unlikely that unknown systematic errors in our dynamical analysis led to calculated values of the mass of HD 206893B and c that are erroneous. Our calculation of the dynamical mass uses a combination of stellar astrometry that may have systematic uncertainties that are not well understood, as well as RV measurements that are impacted by stellar activity (e.g., Grandjean et al. 2019a). However, Table 3 shows that excluding the RV data from our fits gives very similar calculated values for the mass of HD 206893c (12.7 MJup versus 11.5
 MJup with the RVs excluded). It should be noted that in this analysis we did not model the stellar activity in our orbit fit, which may contribute to a slight bias. However, it is unlikely that such unknown systematic errors within our analysis have significantly biased our calculated masses, especially given that our measured dynamical mass of HD 206893c is very much consistent with the predictions presented in Grandjean et al. (2019a) and Kammerer et al. (2021). At most, these systematics could have led to underestimated astrometric uncertainties, but this would not have changed the overall conclusions of this study.
As discussed previously, we compared the spectra from the different atmosphere model families, including SM08 (spectra courtesy of Saumon, 2022), to the GRAVITY data. In several cases the shape is reproduced only approximately, and the shape of the SM08 models is not red enough. However, there is a large amount of correlated noise within the GRAVITY spectrum, precluding a simple statistical analysis. To address this, taking a conservative approach to estimate the systematic modeling error bar on the luminosity of HD 206893c, we therefore adopted the scatter in the Lbol value from an ensemble of different models. We allowed the K-band shape to not exactly match as a way to account for the detailed physics currently missing from the atmospheric models, while assuming that they capture the overall luminosity evolution. The spectral energy distribution over a small wavelength range, for instance the K band, is much more model-dependent than the overall bolometric flux.
Finally, in Appendix C we describe our study of the dynamical stability of the HD 206893 system. Our analysis demonstrates that while the architecture of this system may resemble that of the β Pictoris system, the HD 206893 system is much closer to instability.
5. Conclusions
We have presented the discovery of an inner ∼12 − 13 MJup exoplanet at 3.5 au in the HD 206893 system, making this one of the first directly imaged “hybrid” planetary systems to contain both a BD (Milli et al. 2017) and a bona fide exoplanet. This is also an example of a discovery of an additional companion following a previous discovery of an outer one (e.g., Lagrange et al. 2019; Nowak et al. 2020). The highly precise astrometry delivered by GRAVITY (∼50−100 μarcsec) has enabled us to derive precise dynamical masses of 12.7 MJup for HD 206893c and 28.0
 MJup for HD 206893B. The dynamical mass of B, combined with its luminosity, allows us to immediately and unambiguously establish a robust age of ∼150 Myr for this system. Further, having both an EGP and a BD in the same system with a common age, HD 206893 will serve as an extraordinarily valuable system for the purpose of furthering our understanding of planet formation and highlighting distinctions between the formation pathways of EGPs and BDs.
We have used the theoretical atmospheric models from SM08, which self-consistently treat deuterium burning in substellar objects, to show that the bolometric luminosities of both objects can be well modeled by cloudy or hybrid models; the models allow us to fine-tune the age value to 155 ± 15 Myr. Besides residing in a hybrid exoplanetary system, HD 206893c is an object that straddles the deuterium-burning limit and thus is an ideal laboratory for establishing the precise mass at which this process can occur. In addition to having a dramatic impact on its evolution, the duration and extent of deuterium burning in a substellar object may give valuable clues to its initial conditions and internal structure (e.g., the presence or lack of a rocky core, initial entropy, and initial deuterium abundance; Spiegel & Burrows 2012; Mollière & Mordasini 2012; Bodenheimer et al. 2013; Mordasini 2013). Ours is the first study to begin addressing these questions, and additional related studies may help craft a more robust discrimination between EGPs and BDs.
Finally, in addition to being only the second directly imaged exoplanet whose presence was hinted at using the RV method, our precise dynamical mass for HD 206893c means that this effort potentially represents the first discovery via direct imaging of a bona fide exoplanet that partially relies on precise measurements of the host star astrometry from the Gaia mission. This complements numerous other recent discoveries of substellar companions (e.g., Bonavita et al. 2022; Kuzuhara et al. 2022; Franson et al. 2023, 2022; Currie et al., in prep.) whose discovery also used Gaia astrometry. Using precise Gaia astrometry of the host star to point the way to orbiting planets suitable for direct imaging is expected to be one of the primary strategies for direct exoplanet detection and characterization going forward, thereby ending the current era of “blind” direct imaging EGP searches that have had notoriously low detection rates (e.g., Bowler & Nielsen 2018). Secondly, recent exoplanet direct imaging surveys have had limited sensitivity (e.g., Nielsen et al. 2019; Vigan et al. 2021) to the peak of the orbital distribution of giant exoplanets that coincides with the location of the water ice line at 2−3 au for solar-type stars (e.g., Fernandes et al. 2019; Frelikh et al. 2019; Fulton et al. 2021). However, upcoming interferometric observations using JWST (Ray et al. 2023; Hinkley et al. 2022) are likely to have the combination of sufficient sensitivity and resolution to reach these orbital zones, providing complementary characterization at 3−5 μm. Until then, this discovery of an exoplanet at 3.5 au, along with the discovery of β Pic c (Lagrange et al. 2019; Nowak et al. 2020), is more evidence that optical interferometry now enables direct characterization of these planets at the ice-line orbital separations of 2−4 au, where they form.
Acknowledgments
We are very grateful to D. Saumon for helpful and rapid replies, and kindly sharing data. G.-D.M. acknowledges the support of the DFG priority program SPP 1992 “Exploring the Diversity of Extrasolar Planets” (MA 9185/1) and from the Swiss National Science Foundation under grant 200021_204847 “PlanetsInTime”. Parts of this work have been carried out within the framework of the NCCR PlanetS supported by the Swiss National Science Foundation. P.M. acknowledges support from the European Research Council under the European Union’s Horizon 2020 research and innovation program under grant agreement No. 832428-Origins. S.A. acknowledges support from the European Research Council under the European Union’s Horizon 2020 research and innovation program under grant agreement No. 865624-GPRV. N.Z. acknowledges support from the UK Science and Technology Facilities Council (STFC) under Grant Code ST/N504233/1, studentship no. 194772. This research has made use of the SIMBAD database, operated at CDS, Strasbourg, France. This work has made use of data from the European Space Agency (ESA) mission Gaia (https://www.cosmos.esa.int/gaia), processed by the Gaia Data Processing and Analysis Consortium (DPAC, https://www.cosmos.esa.int/web/gaia/dpac/consortium). Funding for the DPAC has been provided by national institutions, in particular the institutions participating in the Gaia Multilateral Agreement.
References
- Arras, P., & Bildsten, L. 2006, ApJ, 650, 394 [NASA ADS] [CrossRef] [Google Scholar]
- Baraffe, I., Chabrier, G., Barman, T. S., Allard, F., & Hauschildt, P. H. 2003, A&A, 402, 701 [NASA ADS] [CrossRef] [EDP Sciences] [Google Scholar]
- Beust, H., Bonfils, X., Montagnier, G., Delfosse, X., & Forveille, T. 2012, A&A, 545, A88 [NASA ADS] [CrossRef] [EDP Sciences] [Google Scholar]
- Blunt, S., Wang, J. J., Angelo, I., et al. 2020, AJ, 159, 89 [NASA ADS] [CrossRef] [Google Scholar]
- Bodenheimer, P., D’Angelo, G., Lissauer, J. J., Fortney, J. J., & Saumon, D. 2013, ApJ, 770, 120 [NASA ADS] [CrossRef] [Google Scholar]
- Bonavita, M., Fontanive, C., Gratton, R., et al. 2022, MNRAS, 513, 5588 [NASA ADS] [Google Scholar]
- Bonnefoy, M., Currie, T., Marleau, G. D., et al. 2014, A&A, 562, A111 [NASA ADS] [CrossRef] [EDP Sciences] [Google Scholar]
- Bowler, B. P., & Nielsen, E. L. 2018, Occurrence Rates from Direct Imaging Surveys, Handbook of Exoplanets (Springer International Publishing AG), 155 [Google Scholar]
- Bowler, B. P., Liu, M. C., Shkolnik, E. L., & Dupuy, T. J. 2013, ApJ, 774, 55 [NASA ADS] [CrossRef] [Google Scholar]
- Brandt, T. D. 2021, ApJS, 254, 42 [NASA ADS] [CrossRef] [Google Scholar]
- Burrows, A., Hubbard, W. B., Lunine, J. I., & Liebert, J. 2001, Rev. Mod. Phys., 73, 719 [Google Scholar]
- Chabrier, G., Baraffe, I., Allard, F., & Hauschildt, P. 2000, ApJ, 542, 464 [Google Scholar]
- Chabrier, G., Baraffe, I., Selsis, F., et al. 2007, Protostars and Planets V (Tucson: Univeristy of Arizona Press), 623 [Google Scholar]
- Chen, C. H., Mittal, T., Kuchner, M., et al. 2014, ApJS, 211, 25 [Google Scholar]
- David, T. J., & Hillenbrand, L. A. 2015, ApJ, 804, 146 [NASA ADS] [CrossRef] [Google Scholar]
- Delorme, P., Schmidt, T., Bonnefoy, M., et al. 2017, A&A, 608, A79 [NASA ADS] [CrossRef] [EDP Sciences] [Google Scholar]
- Dupuy, T. J., & Liu, M. C. 2012, ApJS, 201, 19 [NASA ADS] [CrossRef] [Google Scholar]
- Dupuy, T. J., Liu, M. C., Evans, E. L., et al. 2023, MNRAS, 519, 1688 [Google Scholar]
- Fabrycky, D., & Tremaine, S. 2007, ApJ, 669, 1298 [NASA ADS] [CrossRef] [Google Scholar]
- Fernandes, R. B., Mulders, G. D., Pascucci, I., Mordasini, C., & Emsenhuber, A. 2019, ApJ, 874, 81 [NASA ADS] [CrossRef] [Google Scholar]
- Foreman-Mackey, D., Hogg, D. W., Lang, D., & Goodman, J. 2013, PASP, 125, 306 [Google Scholar]
- Franson, K., Bowler, B. P., Brandt, T. D., et al. 2022, AJ, 163, 50 [NASA ADS] [CrossRef] [Google Scholar]
- Franson, K., Bowler, B. P., Bonavita, M., et al. 2023, AJ, 165, 39 [NASA ADS] [CrossRef] [Google Scholar]
- Frelikh, R., Jang, H., Murray-Clay, R. A., & Petrovich, C. 2019, ApJ, 884, L47 [NASA ADS] [CrossRef] [Google Scholar]
- Fulton, B. J., Rosenthal, L. J., Hirsch, L. A., et al. 2021, ApJS, 255, 14 [NASA ADS] [CrossRef] [Google Scholar]
- Gaia Collaboration (Prusti, T., et al.) 2016, A&A, 595, A1 [NASA ADS] [CrossRef] [EDP Sciences] [Google Scholar]
- Gaia Collaboration (Brown, A. G. A., et al.) 2018, A&A, 616, A1 [NASA ADS] [CrossRef] [EDP Sciences] [Google Scholar]
- Gaia Collaboration (Brown, A. G. A., et al.) 2021, A&A, 649, A1 [NASA ADS] [CrossRef] [EDP Sciences] [Google Scholar]
- Galland, F., Lagrange, A. M., Udry, S., et al. 2005, A&A, 443, 337 [NASA ADS] [CrossRef] [EDP Sciences] [Google Scholar]
- Gáspár, A., Rieke, G. H., & Ballering, N. 2016, ApJ, 826, 171 [Google Scholar]
- Grandjean, A., Lagrange, A. M., Beust, H., et al. 2019a, A&A, 627, L9 [NASA ADS] [CrossRef] [EDP Sciences] [Google Scholar]
- Grandjean, A., Lagrange, A. M., Beust, H., et al. 2019b, A&A, 629, C1 [NASA ADS] [CrossRef] [EDP Sciences] [Google Scholar]
- GRAVITY Collaboration (Abuter, R., et al.) 2017, A&A, 602, A94 [NASA ADS] [CrossRef] [EDP Sciences] [Google Scholar]
- GRAVITY Collaboration (Lacour, S., et al.) 2019, A&A, 623, L11 [NASA ADS] [CrossRef] [EDP Sciences] [Google Scholar]
- GRAVITY Collaboration (Nowak, M., et al.) 2020, A&A, 633, A110 [NASA ADS] [CrossRef] [EDP Sciences] [Google Scholar]
- GRAVITY Collaboration (Abuter, R., et al.) 2021, A&A, 647, A59 [NASA ADS] [CrossRef] [EDP Sciences] [Google Scholar]
- Helling, C., Dehn, M., Woitke, P., & Hauschildt, P. H. 2008, ApJ, 675, L105 [NASA ADS] [CrossRef] [Google Scholar]
- Hinkley, S., Pueyo, L., Faherty, J. K., et al. 2013, ApJ, 779, 153 [NASA ADS] [CrossRef] [Google Scholar]
- Hinkley, S., Carter, A. L., Ray, S., et al. 2022, PASP, 134, 095003 [CrossRef] [Google Scholar]
- Holmberg, J., Nordström, B., & Andersen, J. 2007, A&A, 475, 519 [CrossRef] [EDP Sciences] [Google Scholar]
- Kammerer, J., Lacour, S., Stolker, T., et al. 2021, A&A, 652, A57 [NASA ADS] [CrossRef] [EDP Sciences] [Google Scholar]
- Kennedy, G. M., & Wyatt, M. C. 2014, MNRAS, 444, 3164 [NASA ADS] [CrossRef] [Google Scholar]
- Kervella, P., Arenou, F., & Thévenin, F. 2022, A&A, 657, A7 [NASA ADS] [CrossRef] [EDP Sciences] [Google Scholar]
- Kozai, Y. 1962, AJ, 67, 591 [Google Scholar]
- Kuzuhara, M., Currie, T., Takarada, T., et al. 2022, ApJ, 934, L18 [NASA ADS] [CrossRef] [Google Scholar]
- Lacour, S., Eisenhauer, F., Gillessen, S., et al. 2014, A&A, 567, A75 [NASA ADS] [CrossRef] [EDP Sciences] [Google Scholar]
- Lacour, S., Dembet, R., Abuter, R., et al. 2019, A&A, 624, A99 [NASA ADS] [CrossRef] [EDP Sciences] [Google Scholar]
- Lacour, S., Wang, J. J., Nowak, M., et al. 2020, SPIE Conf. Ser., 11446, 114460O [NASA ADS] [Google Scholar]
- Lacour, S., Wang, J. J., Rodet, L., et al. 2021, A&A, 654, L2 [NASA ADS] [CrossRef] [EDP Sciences] [Google Scholar]
- Lagrange, A. M., Meunier, N., Chauvin, G., et al. 2013, A&A, 559, A83 [NASA ADS] [CrossRef] [EDP Sciences] [Google Scholar]
- Lagrange, A. M., Meunier, N., Rubini, P., et al. 2019, Nat. Astron., 3, 1135 [NASA ADS] [CrossRef] [Google Scholar]
- Lapeyrere, V., Kervella, P., Lacour, S., et al. 2014, in Optical and Infrared Interferometry IV, eds. J. K. Rajagopal, M. J. Creech-Eakman, & F. Malbet, SPIE Conf. Ser., 9146, 91462D [NASA ADS] [Google Scholar]
- Lazzoni, C., Desidera, S., Marzari, F., et al. 2018, A&A, 611, A43 [NASA ADS] [CrossRef] [EDP Sciences] [Google Scholar]
- Liu, M. C., Dupuy, T. J., & Allers, K. N. 2016, ApJ, 833, 96 [NASA ADS] [CrossRef] [Google Scholar]
- Madhusudhan, N., Amin, M. A., & Kennedy, G. M. 2014, ApJ, 794, L12 [Google Scholar]
- Marino, S., Zurlo, A., Faramaz, V., et al. 2020, MNRAS, 498, 1319 [Google Scholar]
- Marleau, G.-D., & Cumming, A. 2014, MNRAS, 437, 1378 [Google Scholar]
- Marley, M. S., Saumon, D., Visscher, C., et al. 2021, ApJ, 920, 85 [NASA ADS] [CrossRef] [Google Scholar]
- Meshkat, T., Gao, P., Lee, E. J., et al. 2021, ApJ, 917, 62 [NASA ADS] [CrossRef] [Google Scholar]
- Milli, J., Hibon, P., Christiaens, V., et al. 2017, A&A, 597, L2 [NASA ADS] [CrossRef] [EDP Sciences] [Google Scholar]
- Mollière, P., & Mordasini, C. 2012, A&A, 547, A105 [NASA ADS] [CrossRef] [EDP Sciences] [Google Scholar]
- Mollière, P., Molyarova, T., Bitsch, B., et al. 2022, ApJ, 934, 74 [CrossRef] [Google Scholar]
- Moór, A., Ábrahám, P., Derekas, A., et al. 2006, ApJ, 644, 525 [Google Scholar]
- Mordasini, C. 2013, A&A, 558, A113 [NASA ADS] [CrossRef] [EDP Sciences] [Google Scholar]
- Mordasini, C., van Boekel, R., Mollière, P., Henning, T., & Benneke, B. 2016, ApJ, 832, 41 [Google Scholar]
- Nederlander, A., Hughes, A. M., Fehr, A. J., et al. 2021, ApJ, 917, 5 [NASA ADS] [CrossRef] [Google Scholar]
- Netopil, M. 2017, MNRAS, 469, 3042 [NASA ADS] [CrossRef] [Google Scholar]
- Nielsen, E. L., De Rosa, R. J., Macintosh, B., et al. 2019, AJ, 158, 13 [Google Scholar]
- Nowak, M., Lacour, S., Lagrange, A. M., et al. 2020, A&A, 642, L2 [NASA ADS] [CrossRef] [EDP Sciences] [Google Scholar]
- Öberg, K. I., Murray-Clay, R., & Bergin, E. A. 2011, ApJ, 743, L16 [Google Scholar]
- Ray, S., Hinkley, S., Sallum, S., et al. 2023, MNRAS, 519, 2718 [Google Scholar]
- Rein, H., & Liu, S.-F. 2012, A&A, 537, A128 [NASA ADS] [CrossRef] [EDP Sciences] [Google Scholar]
- Rein, H., Hernandez, D. M., Tamayo, D., et al. 2019, MNRAS, 485, 5490 [Google Scholar]
- Saumon, D., & Marley, M. S. 2008, ApJ, 689, 1327 [Google Scholar]
- Silverstone, M. D. 2000, PhD Thesis, University of California, Los Angeles [Google Scholar]
- Spiegel, D. S., & Burrows, A. 2012, ApJ, 745, 174 [Google Scholar]
- Spiegel, D. S., Burrows, A., & Milsom, J. A. 2011, ApJ, 727, 57 [Google Scholar]
- Stolker, T., Quanz, S. P., Todorov, K. O., et al. 2020, A&A, 635, A182 [EDP Sciences] [Google Scholar]
- Vigan, A., Fontanive, C., Meyer, M., et al. 2021, A&A, 651, A72 [EDP Sciences] [Google Scholar]
- Vousden, W. D., Farr, W. M., & Mandel, I. 2016, MNRAS, 455, 1919 [NASA ADS] [CrossRef] [Google Scholar]
- Wang, J. J., Vigan, A., Lacour, S., et al. 2021, AJ, 161, 148 [Google Scholar]
- Ward-Duong, K., Patience, J., Follette, K., et al. 2021, AJ, 161, 5 [Google Scholar]
- Yelverton, B., Kennedy, G. M., Su, K. Y. L., & Wyatt, M. C. 2019, MNRAS, 488, 3588 [Google Scholar]
- Zuckerman, B., & Song, I. 2004, ApJ, 603, 738 [Google Scholar]
Appendix A: Detailed orbit fitting results
We used the default orbital basis in Blunt et al. (2020). The only difference is that τ, the epoch of periastron after a given reference epoch in units of orbital period, uses a reference epoch of MJD 59000. To fit the RV data, we also included two free parameters to fit for a bulk offset in the RV (γRV) and a jitter term to inflate the error bars on the RV data to better account for stellar activity (σRV). We list the median and 68-percentile credible intervals centered about the median as the error bars in Table A.1. We also computed orbital periods (PB and Pc) for both companions as well as the mutual inclination of their orbits; they are listed in Table A.1.
Full set of fitted orbital parameters for HD 206893B and c, in Jacobi coordinates, with some derived parameters included.
Appendix B: HD 206893 debris structure
HD 206893 also hosts a prominent debris disk, as indicated by a high fractional luminosity of Ldust/L⋆ = 2.3 × 10⁻⁴ (Moór et al. 2006). The disk was originally identified by ISO instrument (Silverstone 2000) and subsequently characterized in greater detail with Spitzer (Chen et al. 2014), Herschel, and ALMA observations (Milli et al. 2017; Marino et al. 2020; Nederlander et al. 2021). Marino et al. (2020) imaged the disk with ALMA, finding that the radial structure is broad, extending from 30 to 180 au, with a 27 au wide gap at 74 au. We re-analyzed the Spitzer IRS spectrum of HD 206893 to recalculate the temperature, 499 K, of the warm dust component found by Chen et al. (2014), finding it to be consistent with the methods described in Kennedy & Wyatt (2014). Our reconstruction of the star + disk spectrum using the methods described by Yelverton et al. (2019) is consistent with a single dust component with a temperature of approximately 50 K. The inner disk edge is therefore likely consistent with inner truncation through interaction with HD 206893B. Following the method presented in Lazzoni et al. (2018), we analytically estimated that the region cleared from dust due to the presence of the two planets extends from ∼1.5 au to ∼15.5 au. Since the clearing zone of the planets cannot cover the outer extent of the gap, detected at 30 au (Marino et al. 2020), this could imply the presence of a third smaller planet responsible for shaping the inner edge of the disk.
Appendix C: Dynamical analysis
Various dynamical considerations can be made from the results of the orbital fit. First, we note that the orbital architecture of the companions does not exhibit a clear resonant configuration. Indeed, as can be seen in Fig. C.1, the probability distribution of the period ratio lies between the 4:1 and 5:1, and favours instead 9:2, which corresponds to a seventh-order mean-motion resonance. Such a high-order mean-motion resonance is not strong enough to induce the libration of a resonant angle, especially when the companions are so massive. Thus, we do not expect resonant capture or phase protection to play a role in the shaping or the stability of the companions’ orbits.
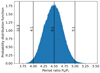 |
Fig. C.1. Probability distribution of HD 206893B and c period ratios from the orbital fit. |
If the orbital configuration looks very similar at first to that of the β Pictoris system, the dynamics of the HD 206893 system is much closer to instability. This is due to the smaller separation between the two companions, and the higher mass and eccentricity of the inner companion. We randomly sampled 1000 orbital solutions from the orbital fit and performed N-body simulations that started from these solutions and lasted for 105 yr. The simulations were performed using the Mercurius integrator in the Rebound package (Rein & Liu 2012; Rein et al. 2019), with a time-step of 0.1 yr. We monitored the eccentricities of both companions and stopped the simulations if one of them reached 1. The results are displayed in Fig. C.2: the simulations exclude eB > 0.15 and aB < 9.5 au, and they disfavor the highest masses. Extending the integration to 106 yr does not significantly change the results, so we can assume the stable configurations remain stable for longer than the integration time. The probability that we are observing the system within 105 yr of a companion’s ejection is very unlikely given its age; therefore, the system is likely long-term stable. Despite the relatively large mutual separation, the system can be considered compact, as the orbits of the companions are close to instability. This suggests that ejection may be a likely outcome of the formation of two massive companions in planetary-like orbits.
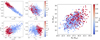 |
Fig. C.2. Maximum eccentricity reached by either companion in N-body simulations with initial conditions representative of the orbital solutions. The simulations are performed for 105 yr using the Mercurius integrator. |
Another important characteristic of this hierarchical three-body system is its relative coplanarity. Table A.1 shows that the mutual inclination between both orbital planes is ∼15° at most. This actually reinforces the similarity with the β Pictoris system and is low enough to keep this system far enough from Kozai–Lidov resonance (Kozai 1962). That dynamical mechanism typically concerns nested orbits of different sizes that have a sufficiently high mutual inclination (≳39° theoretically). When this occurs, the inner orbit is subject to large-amplitude eccentricity oscillations that can drive it to very high values, close to unity. This can lead to direct instability or to a potential collision with the central star due to a decaying periastron. The latter fate can be prevented by tides within the inner orbit; even in that case, however, the orbit does not remain as it was and, furthermore, shrinks significantly (Fabrycky & Tremaine 2007; Beust et al. 2012). The mutual inclination determination (Table A.1) shows that there is no risk of Kozai–Lidov resonance here, which reinforces the idea that the system is stable. This also favors the idea that the debris disk is stable, as disk particles could be affected by the Kozai–Lidov mechanism as well.
Finally, we note that the stable configurations are just snapshots of a system with complex and evolving dynamics. We used the approach described in Lacour et al. (2021) to estimate the secular eccentricity variation and the associated period. We excluded solutions with eB > 0.15 and ab < 9.5 au to ensure stability. The results are displayed in Fig. C.3. The eccentricity of HD 206893B can periodically vanish, while ec can reach values as high as 0.5. These variations are expected to occur over timescales of ∼104 yr. This is important to keep in mind when discussing the formation of the orbital architecture (as it could have formed at any point in the secular cycle) or the impact of the companions on the other components of the system, such as a debris disk or additional planets.
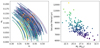 |
Fig. C.3. Secular evolution of the eccentricities of B and c due to their mutual interaction. Left is the trajectory in (eB, ec) phase space, starting from the observed values (orange crosses, which are random solutions to the orbital fit using all available data). We exclude the initial conditions with eB > 0.15 and aB < 9.5 au. The colors represent the corresponding eccentricity evolution period (secular period). The right panel represents the aforementioned period with respect to the mass of b. |
All Tables
Orbital and physical parameters for HD 206893c and re-evaluated parameters of HD 206893B.
Full set of fitted orbital parameters for HD 206893B and c, in Jacobi coordinates, with some derived parameters included.
All Figures
|
Fig. 1. Left: RVs and proper motion anomaly: HARPS RVs for HD 206893 (e.g., Grandjean et al. 2019a) along with samples from the posterior for the model fit to the RVs and proper motion anomalies. Right: posterior distributions for our best-fit model of the predicted proper motion anomaly (purple histograms), calculated as the difference between the Gaia EDR3 proper motion, and the long-term proper motion, calculated by comparing Gaia and HIPPARCOS data (labelled “HG” in the figure) and displayed individually in terms of right ascension and declination. The vertical blue lines show the actual values, with 1σ uncertainties represented by the dashed lines. |
| In the text | |
|
Fig. 2. Periodogram power maps, similar to the one presented in Nowak et al. (2020), obtained for three different observations of HD 206893c: one resulting in a non-detection during the search for the planet (in August 2021) and two clear detections in September and October 2021. |
| In the text | |
|
Fig. 3. Diagram showing the class of orbits consistent with the measured astrometry for HD 206893B (blue orbits) and HD 206893c (red orbits). The HD 206893B astrometry comes from astrometry obtained in Milli et al. (2017), Delorme et al. (2017), Grandjean et al. (2019a), Stolker et al. (2020), and Ward-Duong et al. (2021), as well as the recent GRAVITY detections. The right panels are magnifications (50−100x) of portions of the orbits, highlighting the ∼50−100 microarcsecond astrometric precision. |
| In the text | |
|
Fig. 4. Combined R ∼ 500 GRAVITY K-band spectra of HD 206893c and B (red and light purple, respectively) together with the best-fit DRIFT-PHOENIX models (black and light brown). Shown in light orange, green, and blue is archival spectrophotometry of B that was also included in the fit. For the model spectra, several samples drawn from the posterior distribution are shown with thin lines. |
| In the text | |
|
Fig. 5. Isochrones and cooling curves for both HD 206893B and c. Left: isochrones from Saumon & Marley (2008) that match the dynamical mass and bolometric luminosity of HD 206893B, with the respective age indicated in the legend. The deuterium-burning mass limit, which depends on bulk planetary properties, is shown as a fuzzy pink region (Spiegel et al. 2011). Right: corresponding cooling curves for the best-fit masses. The system age of 155 ± 15 Myr comes from our isochrone analysis (see text). The thick part of the hybrid cooling curves highlights 1400 K > Teff > 1200 K, with cloudy (clear) atmospheres at earlier (later) times. |
| In the text | |
|
Fig. C.1. Probability distribution of HD 206893B and c period ratios from the orbital fit. |
| In the text | |
|
Fig. C.2. Maximum eccentricity reached by either companion in N-body simulations with initial conditions representative of the orbital solutions. The simulations are performed for 105 yr using the Mercurius integrator. |
| In the text | |
|
Fig. C.3. Secular evolution of the eccentricities of B and c due to their mutual interaction. Left is the trajectory in (eB, ec) phase space, starting from the observed values (orange crosses, which are random solutions to the orbital fit using all available data). We exclude the initial conditions with eB > 0.15 and aB < 9.5 au. The colors represent the corresponding eccentricity evolution period (secular period). The right panel represents the aforementioned period with respect to the mass of b. |
| In the text | |
Current usage metrics show cumulative count of Article Views (full-text article views including HTML views, PDF and ePub downloads, according to the available data) and Abstracts Views on Vision4Press platform.
Data correspond to usage on the plateform after 2015. The current usage metrics is available 48-96 hours after online publication and is updated daily on week days.
Initial download of the metrics may take a while.