Fig. 4.
Download original image
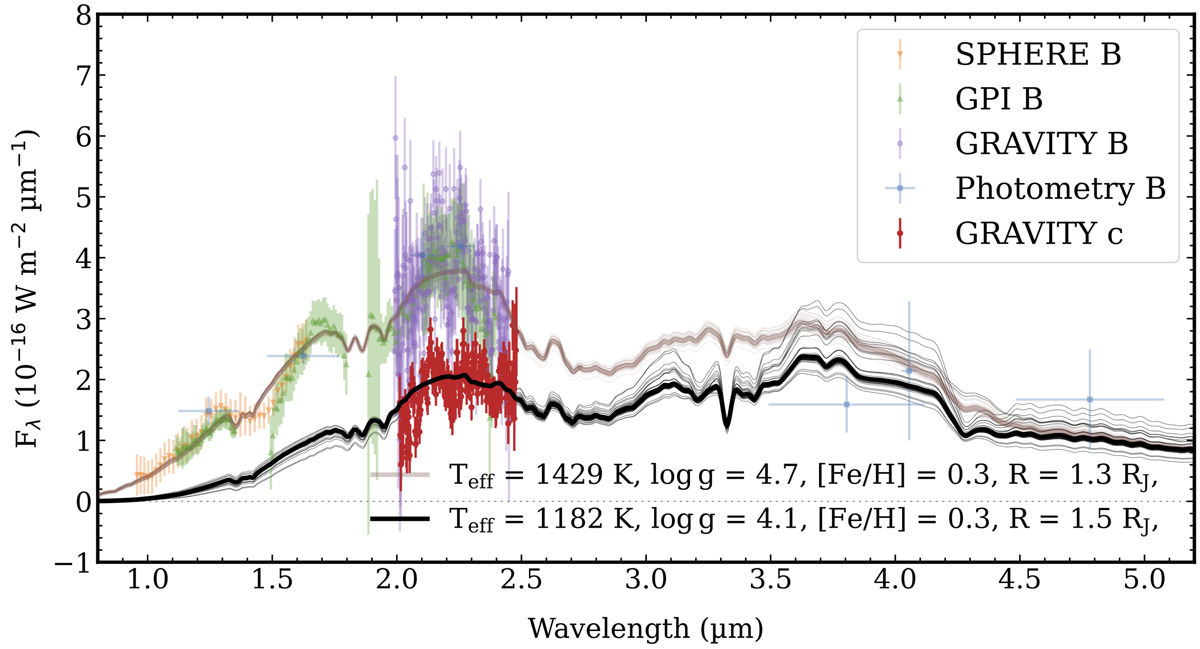
Combined R ∼ 500 GRAVITY K-band spectra of HD 206893c and B (red and light purple, respectively) together with the best-fit DRIFT-PHOENIX models (black and light brown). Shown in light orange, green, and blue is archival spectrophotometry of B that was also included in the fit. For the model spectra, several samples drawn from the posterior distribution are shown with thin lines.
Current usage metrics show cumulative count of Article Views (full-text article views including HTML views, PDF and ePub downloads, according to the available data) and Abstracts Views on Vision4Press platform.
Data correspond to usage on the plateform after 2015. The current usage metrics is available 48-96 hours after online publication and is updated daily on week days.
Initial download of the metrics may take a while.