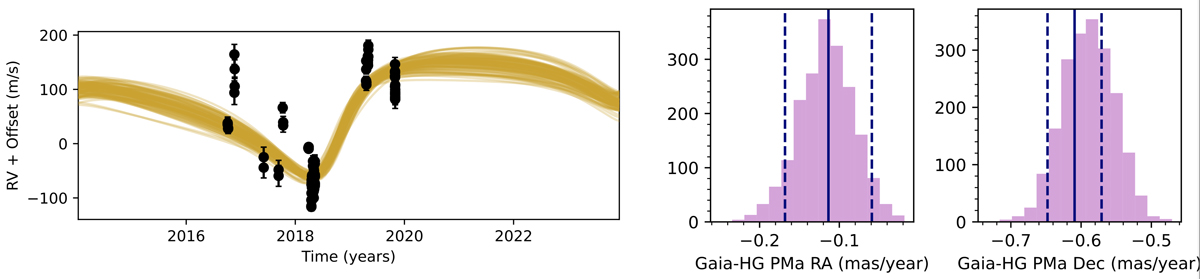
Fig. 1.
Download original image
Left: RVs and proper motion anomaly: HARPS RVs for HD 206893 (e.g., Grandjean et al. 2019a) along with samples from the posterior for the model fit to the RVs and proper motion anomalies. Right: posterior distributions for our best-fit model of the predicted proper motion anomaly (purple histograms), calculated as the difference between the Gaia EDR3 proper motion, and the long-term proper motion, calculated by comparing Gaia and HIPPARCOS data (labelled “HG” in the figure) and displayed individually in terms of right ascension and declination. The vertical blue lines show the actual values, with 1σ uncertainties represented by the dashed lines.
Current usage metrics show cumulative count of Article Views (full-text article views including HTML views, PDF and ePub downloads, according to the available data) and Abstracts Views on Vision4Press platform.
Data correspond to usage on the plateform after 2015. The current usage metrics is available 48-96 hours after online publication and is updated daily on week days.
Initial download of the metrics may take a while.