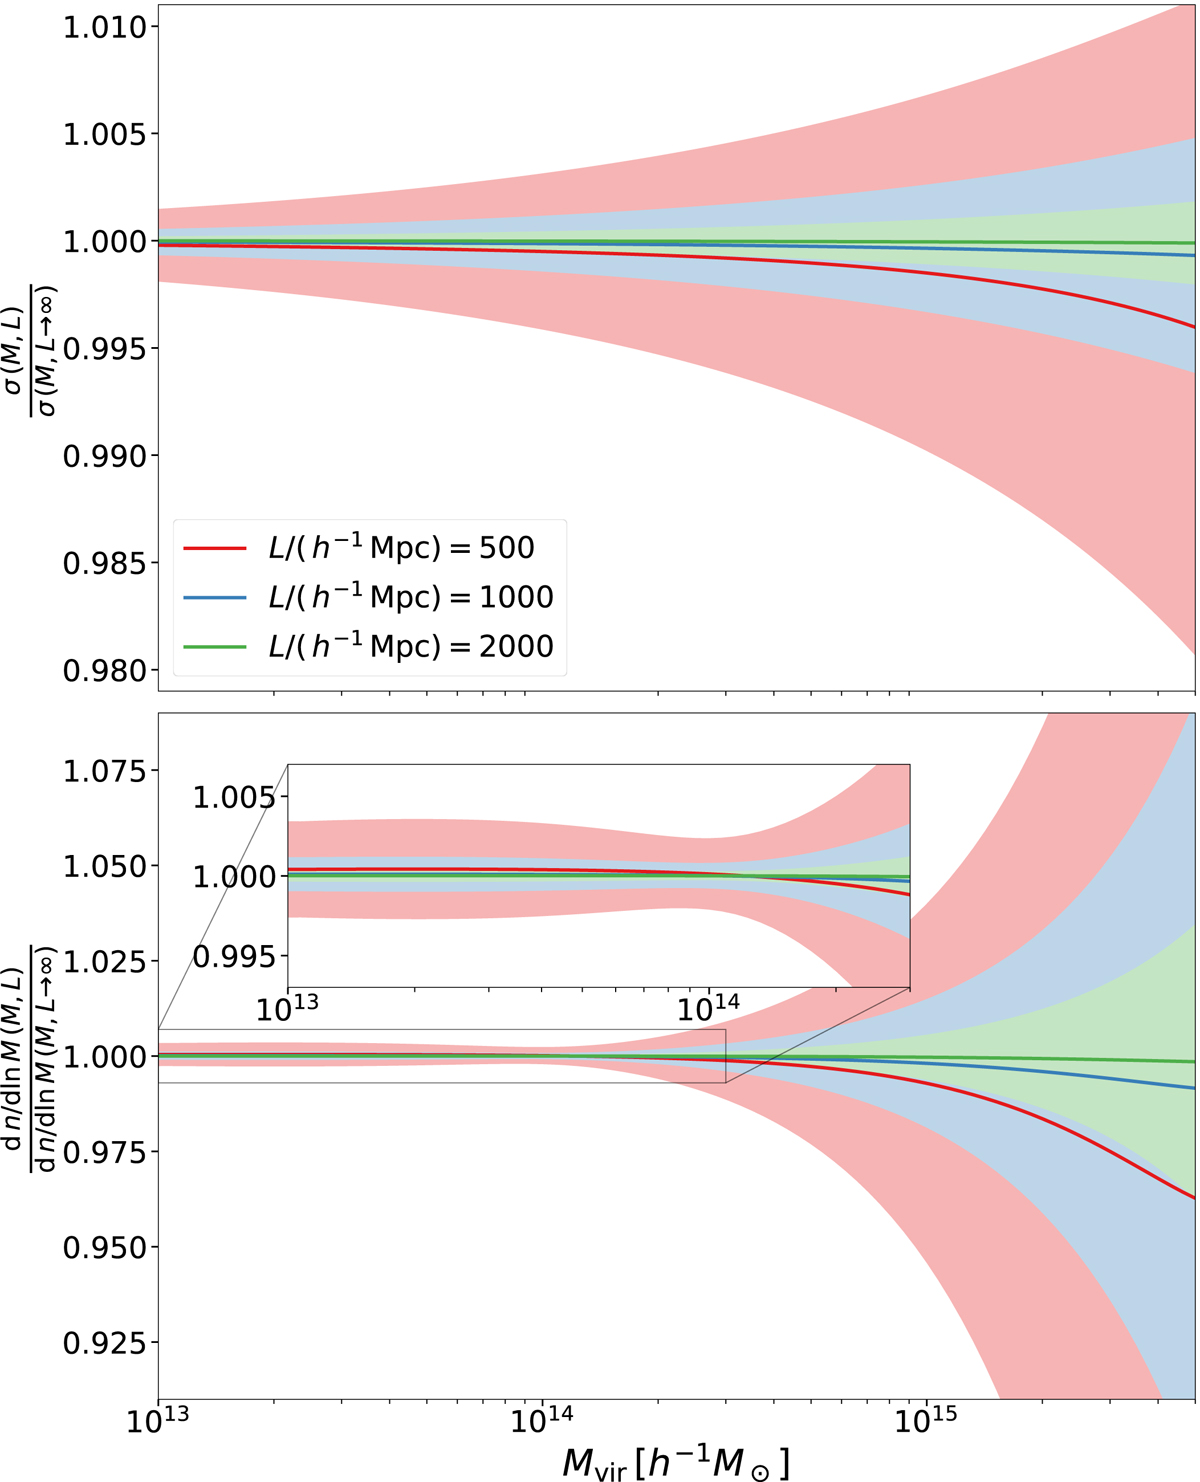
Fig. 8.
Download original image
Impact of the simulation box size L on the mass variance (top panel) and the differential HMF (bottom panel) for three different cases L = {500, 1000, 2000} h−1 Mpc depicted in red, blue, and green, respectively. Solid lines represent the mean effect due to the truncation of the mass variance integration to the fundamental mode. The corresponding shaded regions correspond to the 68 percent interval due to the sample variance.
Current usage metrics show cumulative count of Article Views (full-text article views including HTML views, PDF and ePub downloads, according to the available data) and Abstracts Views on Vision4Press platform.
Data correspond to usage on the plateform after 2015. The current usage metrics is available 48-96 hours after online publication and is updated daily on week days.
Initial download of the metrics may take a while.