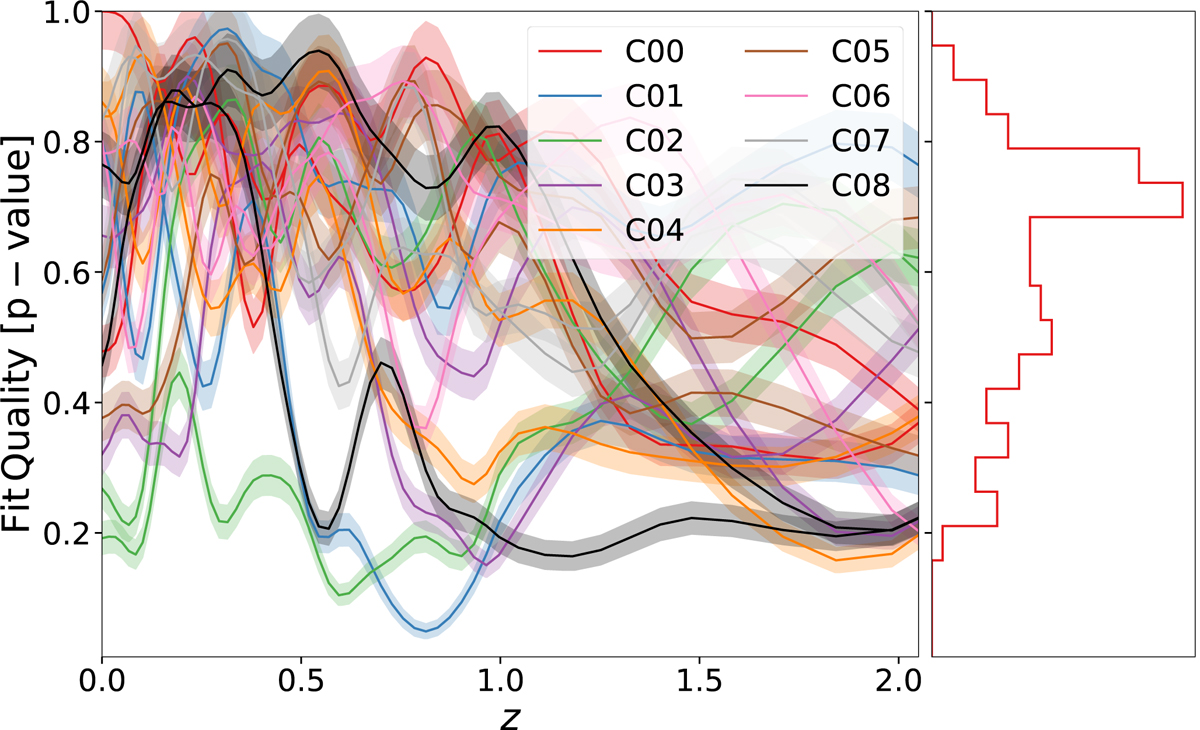
Fig. C.1.
Download original image
Dependence of ROCKSTAR fit quality as a function of redshift. The fit quality (p-value) was estimated from sampling from the likelihood used for the calibration assuming the best-fit parameters. The p-value is the fraction of random catalogues that had a residual higher than the original catalogue. On the right panel, we present the histogram projection of the left panel.
Current usage metrics show cumulative count of Article Views (full-text article views including HTML views, PDF and ePub downloads, according to the available data) and Abstracts Views on Vision4Press platform.
Data correspond to usage on the plateform after 2015. The current usage metrics is available 48-96 hours after online publication and is updated daily on week days.
Initial download of the metrics may take a while.