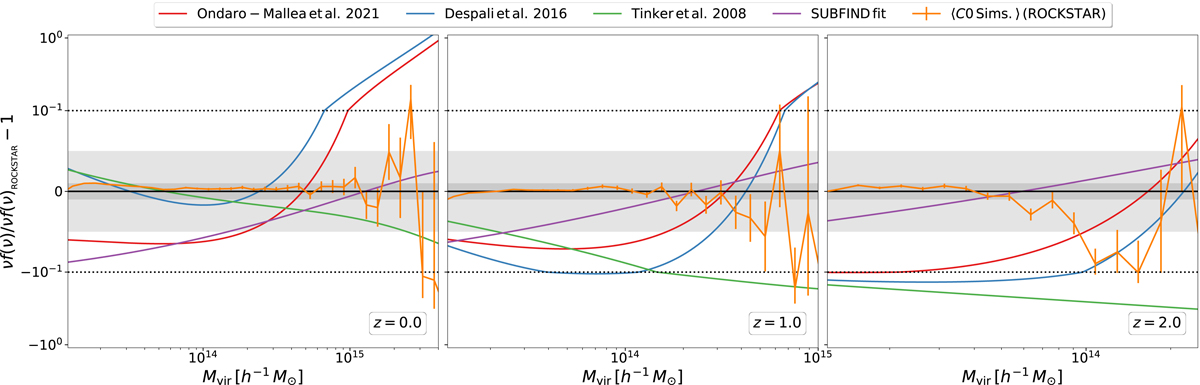
Fig. 18.
Download original image
Comparison of our HMF model to the works of Tinker et al. (2008), Despali et al. (2016), and Ondaro-Mallea et al. (2021). We use our ROCKSTAR calibration as the reference and present our SUBFIND calibration for easy comparison with Ondaro-Mallea et al. (2021). We also present the mean of the multiplicity function νf(ν) measured from the ten PICCOLO C0 runs. The grey regions depict the 1 and 5 percent regions. We adopted a symmetric-log scale on the y-axis, where the region between the dashed lines is presented in a linear scale.
Current usage metrics show cumulative count of Article Views (full-text article views including HTML views, PDF and ePub downloads, according to the available data) and Abstracts Views on Vision4Press platform.
Data correspond to usage on the plateform after 2015. The current usage metrics is available 48-96 hours after online publication and is updated daily on week days.
Initial download of the metrics may take a while.