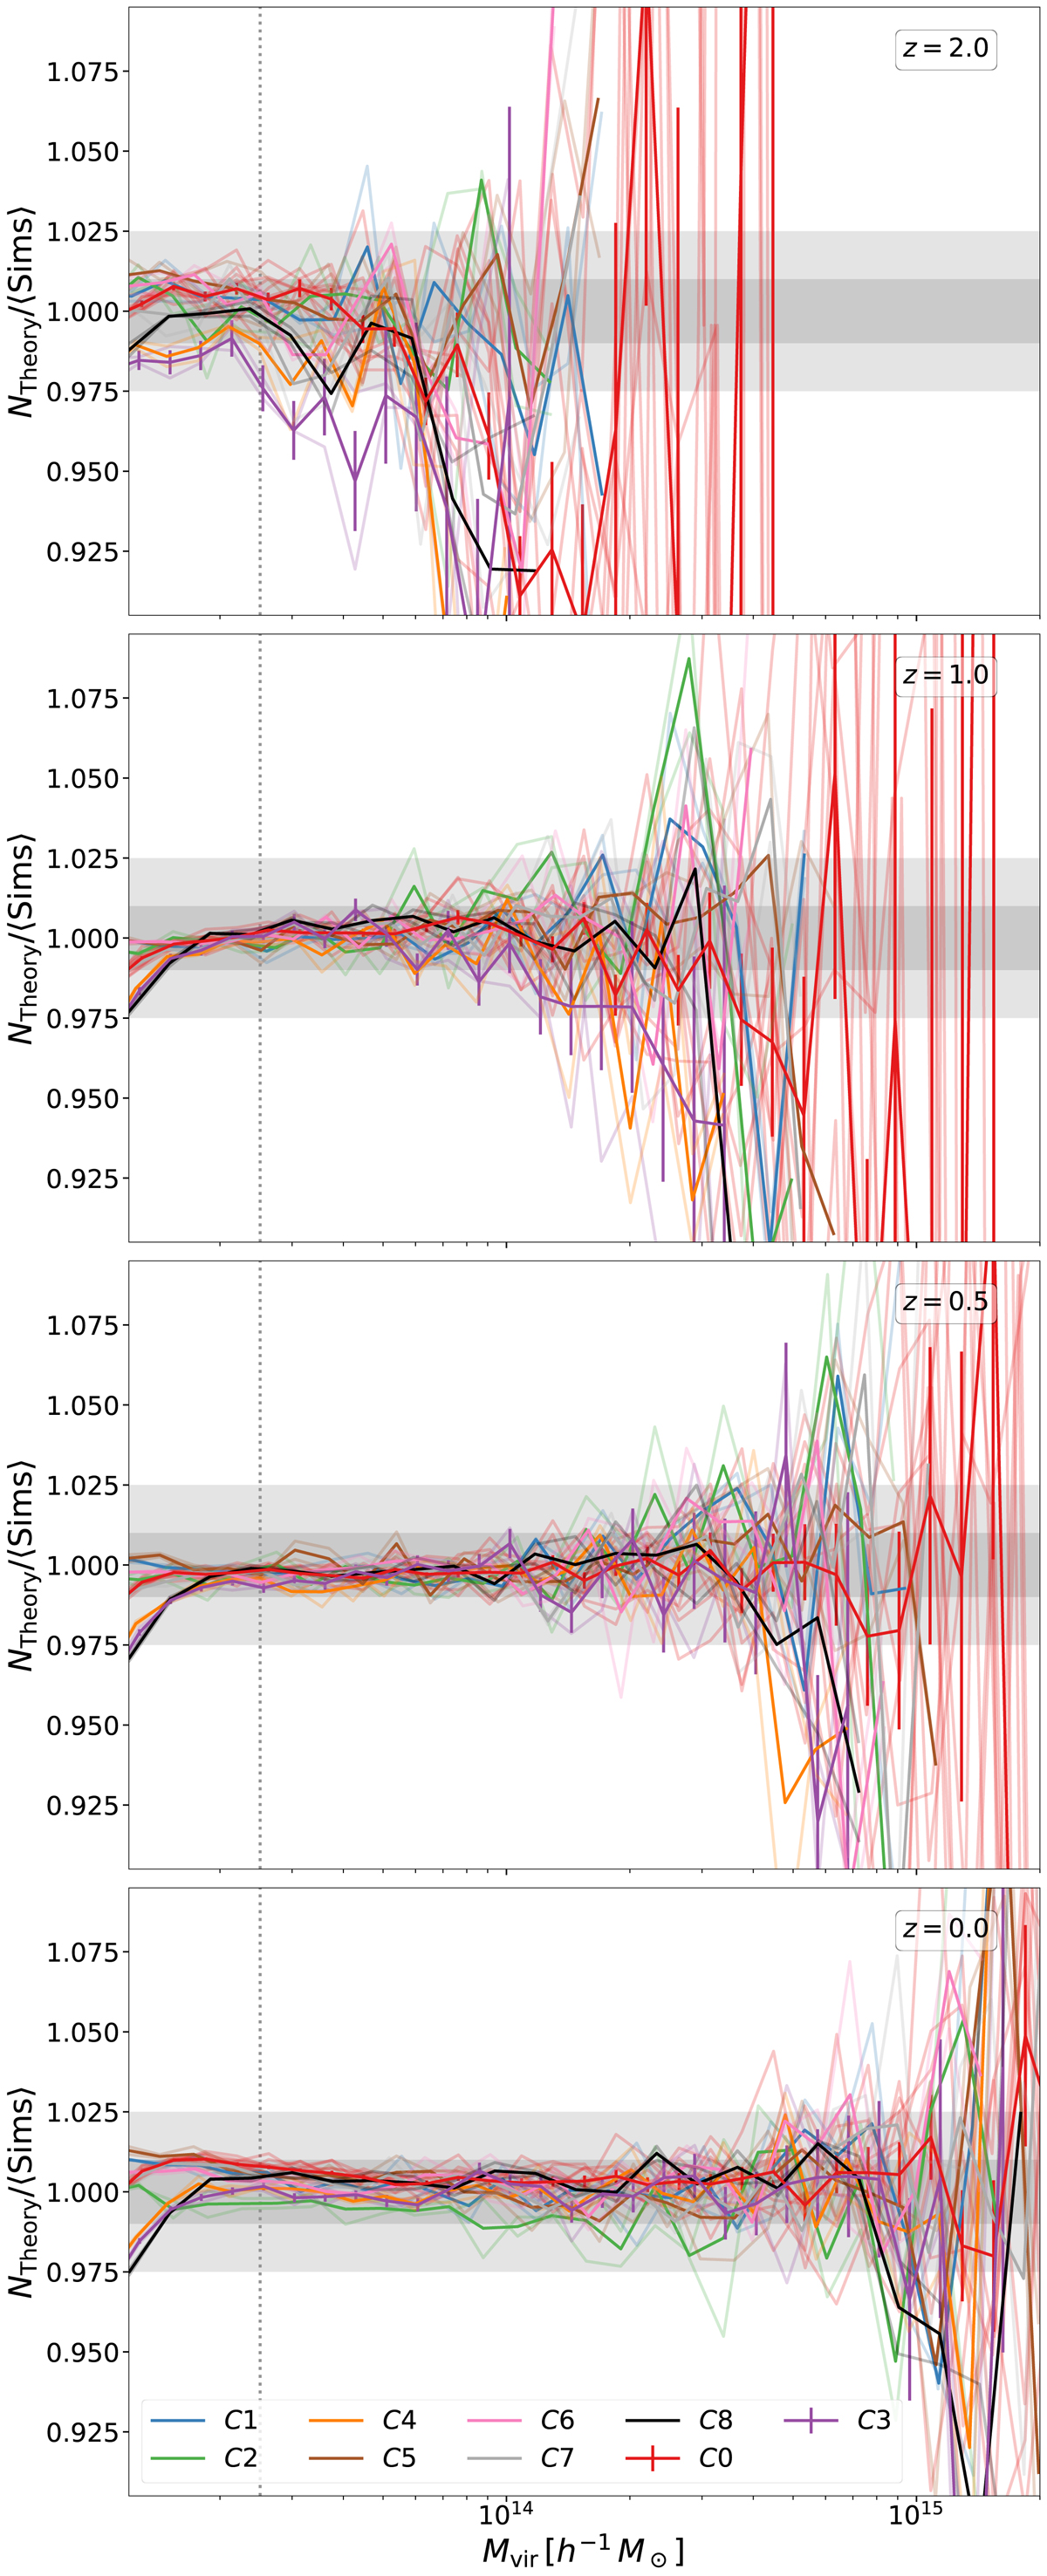
Fig. 15.
Download original image
Ratio of ROCKSTAR best-fit to the mean abundance of halos extracted from the simulations at z = {0, 0.5, 1.0, 2.0}. The vertical dotted line represents the cut in mass corresponding to the minimum number of 300 particles for the C0 runs. The regions in grey represent the relative 1% and 2.5% regions. The Poisson error bars correspond to the C0 and C3 (our cosmology with fewer halos), which count with ten and two realisations, respectively. We only show mass bins with more than 50 halos for improved readability.
Current usage metrics show cumulative count of Article Views (full-text article views including HTML views, PDF and ePub downloads, according to the available data) and Abstracts Views on Vision4Press platform.
Data correspond to usage on the plateform after 2015. The current usage metrics is available 48-96 hours after online publication and is updated daily on week days.
Initial download of the metrics may take a while.