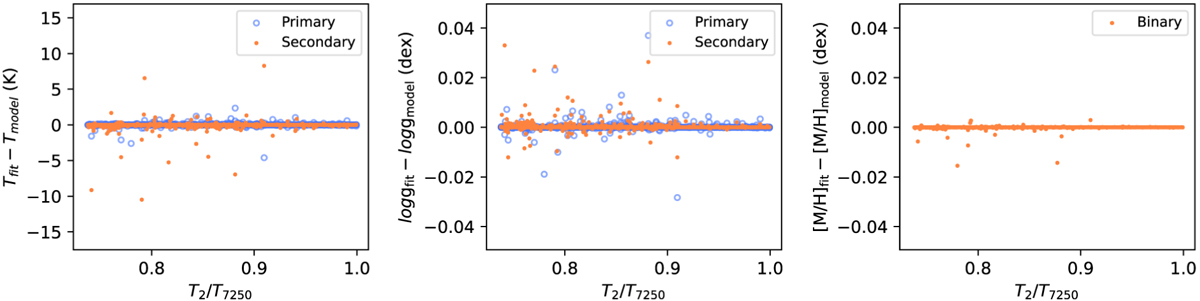
Fig. 6
Download original image
Parameter differences between the measured values and the theoretical values. Blue circles in ∆Teff and ∆ log g panels show the differences between the primary stars, and orange dots show the differences between the secondary stars. One metallicity is fitted for each binary system, so the ∆[M/H] panels contain only orange points. All the binaries in this figure have the primary component blueshifted in the SB2 spectra.
Current usage metrics show cumulative count of Article Views (full-text article views including HTML views, PDF and ePub downloads, according to the available data) and Abstracts Views on Vision4Press platform.
Data correspond to usage on the plateform after 2015. The current usage metrics is available 48-96 hours after online publication and is updated daily on week days.
Initial download of the metrics may take a while.