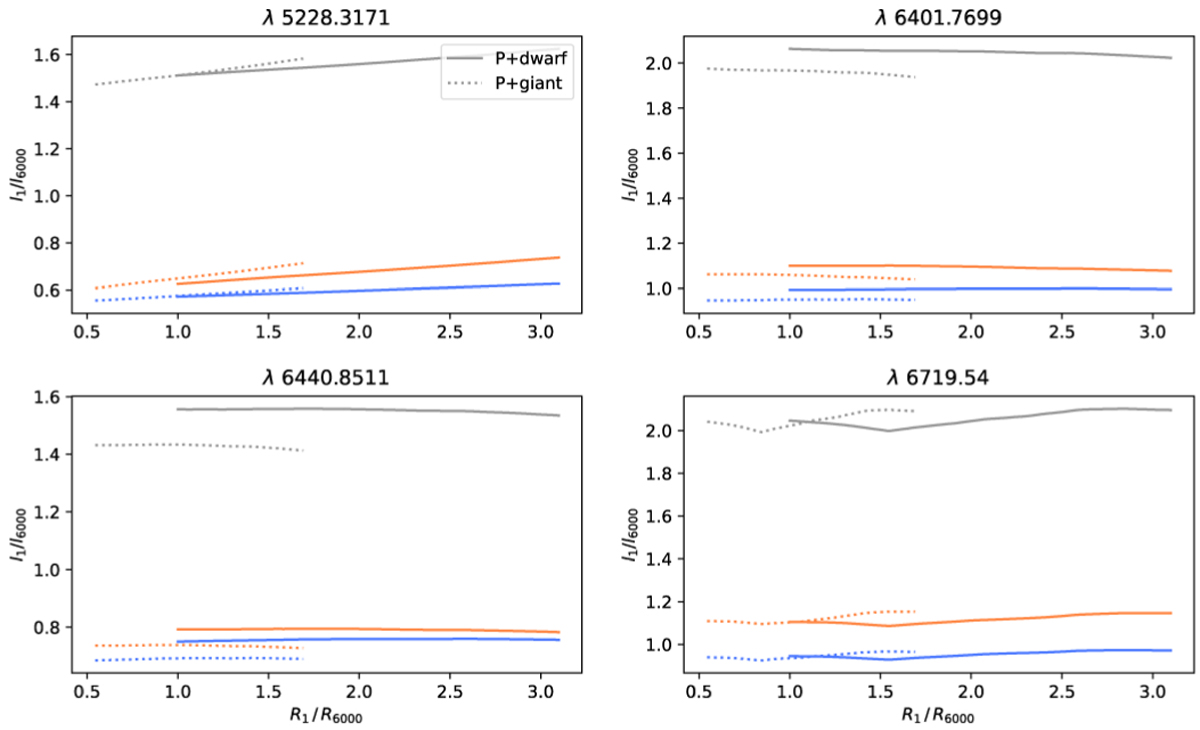
Fig. 5
Download original image
Line intensity ratios change with different radii. The grey lines represent the ratio between two spectra of single stars, and the colourful lines are the ratio between two star components in the binary spectra. The blue lines mean that the 7250 K components are blueshifted in SB2 spectra, and the orange lines mean that the 7250 K components are redshifted. Different line styles stand for different parameter combinations.
Current usage metrics show cumulative count of Article Views (full-text article views including HTML views, PDF and ePub downloads, according to the available data) and Abstracts Views on Vision4Press platform.
Data correspond to usage on the plateform after 2015. The current usage metrics is available 48-96 hours after online publication and is updated daily on week days.
Initial download of the metrics may take a while.