Fig. 3
Download original image
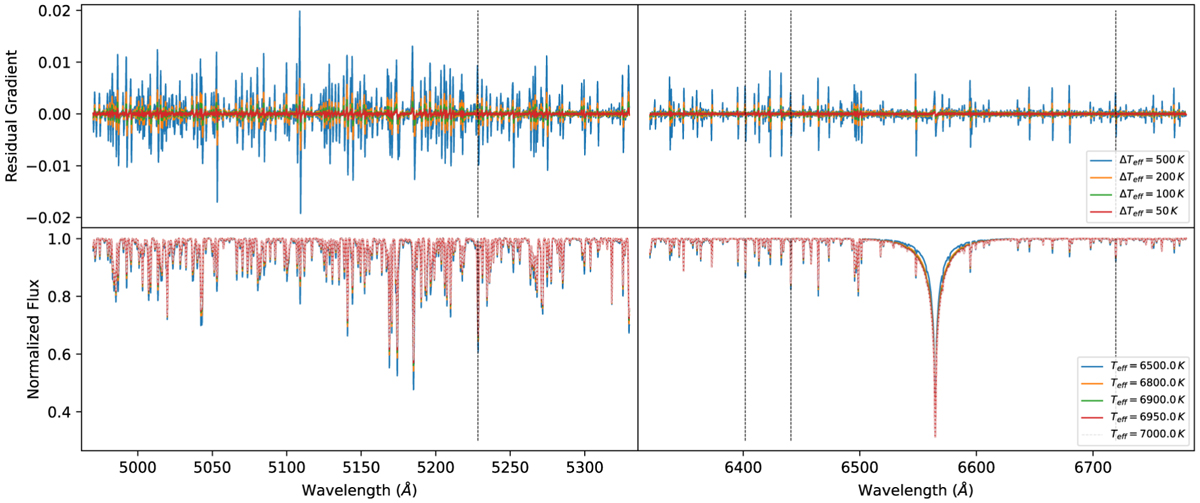
The lines to obtain the line intensity ratios. The upper panel shows the gradient of line intensity differences of four Teff gaps: 7000–50/100/200/500 K. The lower panel contains the corresponding spectra. Different colours represent spectra with different Teff. The grey dashed lines indicate the spectral lines we chose to produce Figs. 4 and 5.
Current usage metrics show cumulative count of Article Views (full-text article views including HTML views, PDF and ePub downloads, according to the available data) and Abstracts Views on Vision4Press platform.
Data correspond to usage on the plateform after 2015. The current usage metrics is available 48-96 hours after online publication and is updated daily on week days.
Initial download of the metrics may take a while.