Open Access
Fig. 10
Download original image
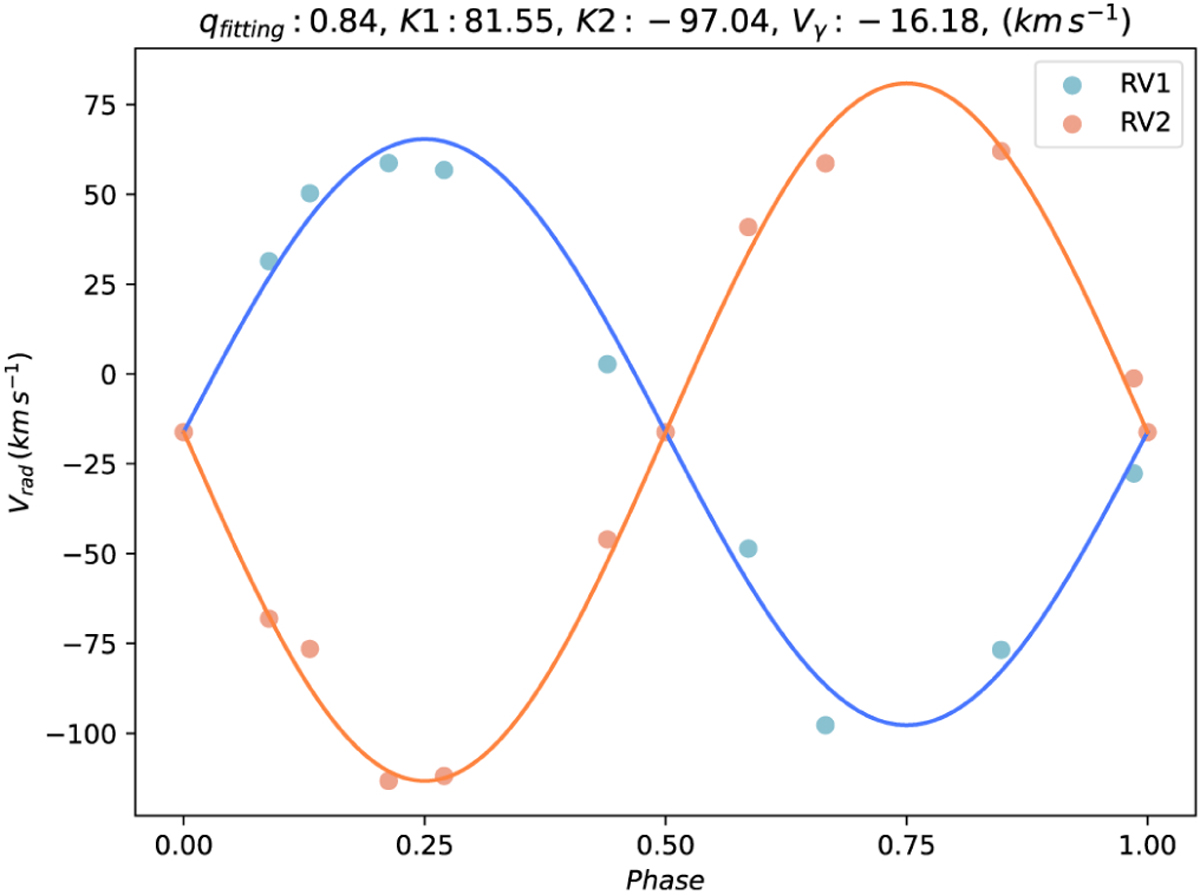
Reconstructed radial velocity curves of TIC 63209649. Dots are the RVs measured by the spectra except for three dots in the phases 0, 0.5, and 1, which are set manually to γ. Lines are the reconstructed curves. Blue represents the higher mass star and orange represents the lower mass star.
Current usage metrics show cumulative count of Article Views (full-text article views including HTML views, PDF and ePub downloads, according to the available data) and Abstracts Views on Vision4Press platform.
Data correspond to usage on the plateform after 2015. The current usage metrics is available 48-96 hours after online publication and is updated daily on week days.
Initial download of the metrics may take a while.