Fig. 1
Download original image
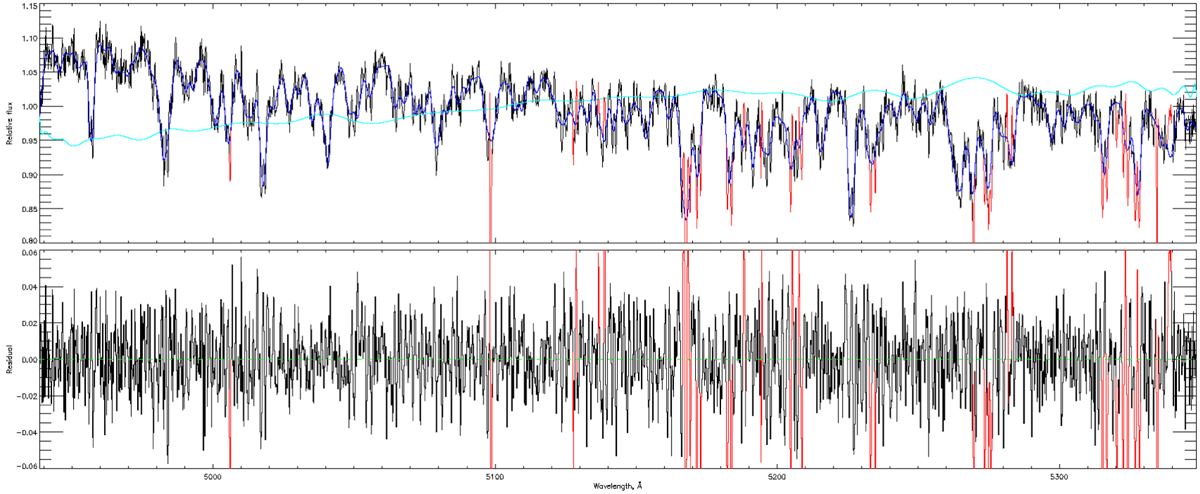
LASP fitting result of an SB2 spectrum. The upper panel is the spectrum, and the lower panel is the fitting residual. The black line in the upper panel is the pseudo-continuum-normalised LAMOST MRS spectrum, the blue line is the best fitting spectrum, and the cyan line represents the polynomial correction between the observed spectrum and the model. Red lines in both panels represent the masked wavelength.
Current usage metrics show cumulative count of Article Views (full-text article views including HTML views, PDF and ePub downloads, according to the available data) and Abstracts Views on Vision4Press platform.
Data correspond to usage on the plateform after 2015. The current usage metrics is available 48-96 hours after online publication and is updated daily on week days.
Initial download of the metrics may take a while.