Fig. 4
Download original image
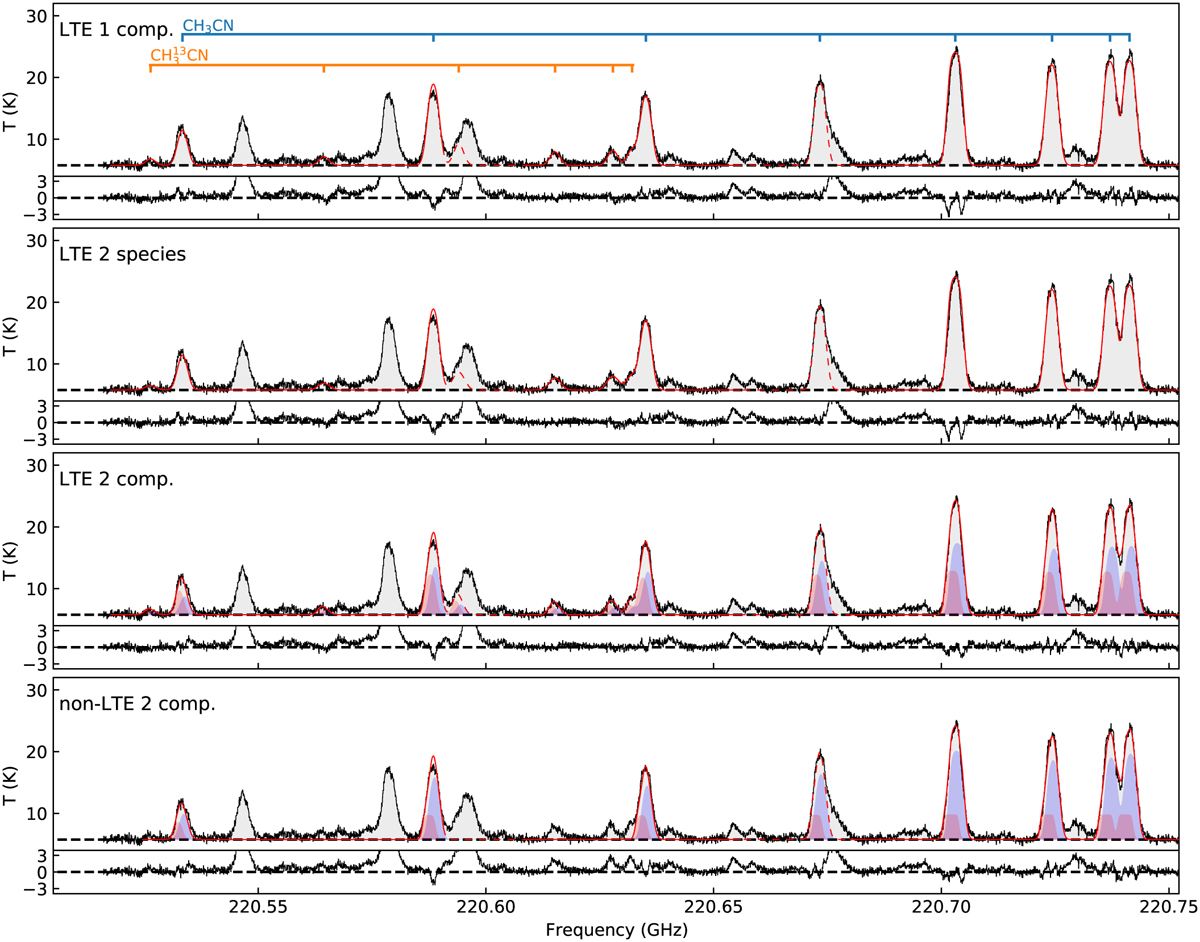
Modeled CH3CN and CH313CN spectra overlaid on the observed spectra. The first panel shows the LTE model one velocity component fitting. The second panel is the same as the first panel but treats CH3CN and CH313CN as two species with independent temperature, velocity and linewidth. The third panel is the LTE two velocity component fitting, while the fourth panel shows the non-LTE one. The red curve shows the modeled spectrum. The K = 4 component of CH3CN and K = 3 component of CH313CN suffer from severe line contamination so they were not included in the fitting. The model in these frequency ranges is shown with the dashed line. The red and blue shaded areas in the two bottom panels represent the modeled spectrum from the individual components. The residual from the best-fit is shown in the bottom frame of each panel. The best-fit parameters are listed in Table 1 and the corner plots are shown in Appendix A.
Current usage metrics show cumulative count of Article Views (full-text article views including HTML views, PDF and ePub downloads, according to the available data) and Abstracts Views on Vision4Press platform.
Data correspond to usage on the plateform after 2015. The current usage metrics is available 48-96 hours after online publication and is updated daily on week days.
Initial download of the metrics may take a while.