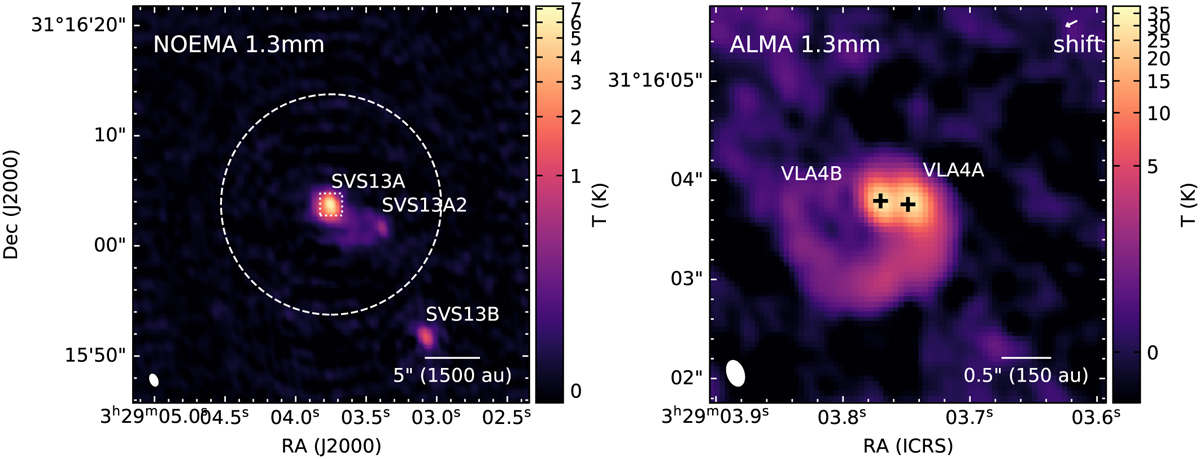
Fig. 1
Download original image
1.3 mm continuum emission toward the SVS13 region from NOEMA (left, rms ~20 mK) and ALMA (right) observations. In the left panel, the dashed circle shows the primary beam of the NOEMA observation and the dashed box represents the FoV in the right panel. The black plus signs represent the positions of VLA4A/B from Hsieh et al. (2019). The arrow in the top right corner indicates the shift (0″.13) of the self-calibrated ALMA image.
Current usage metrics show cumulative count of Article Views (full-text article views including HTML views, PDF and ePub downloads, according to the available data) and Abstracts Views on Vision4Press platform.
Data correspond to usage on the plateform after 2015. The current usage metrics is available 48-96 hours after online publication and is updated daily on week days.
Initial download of the metrics may take a while.