Fig. 4
Download original image
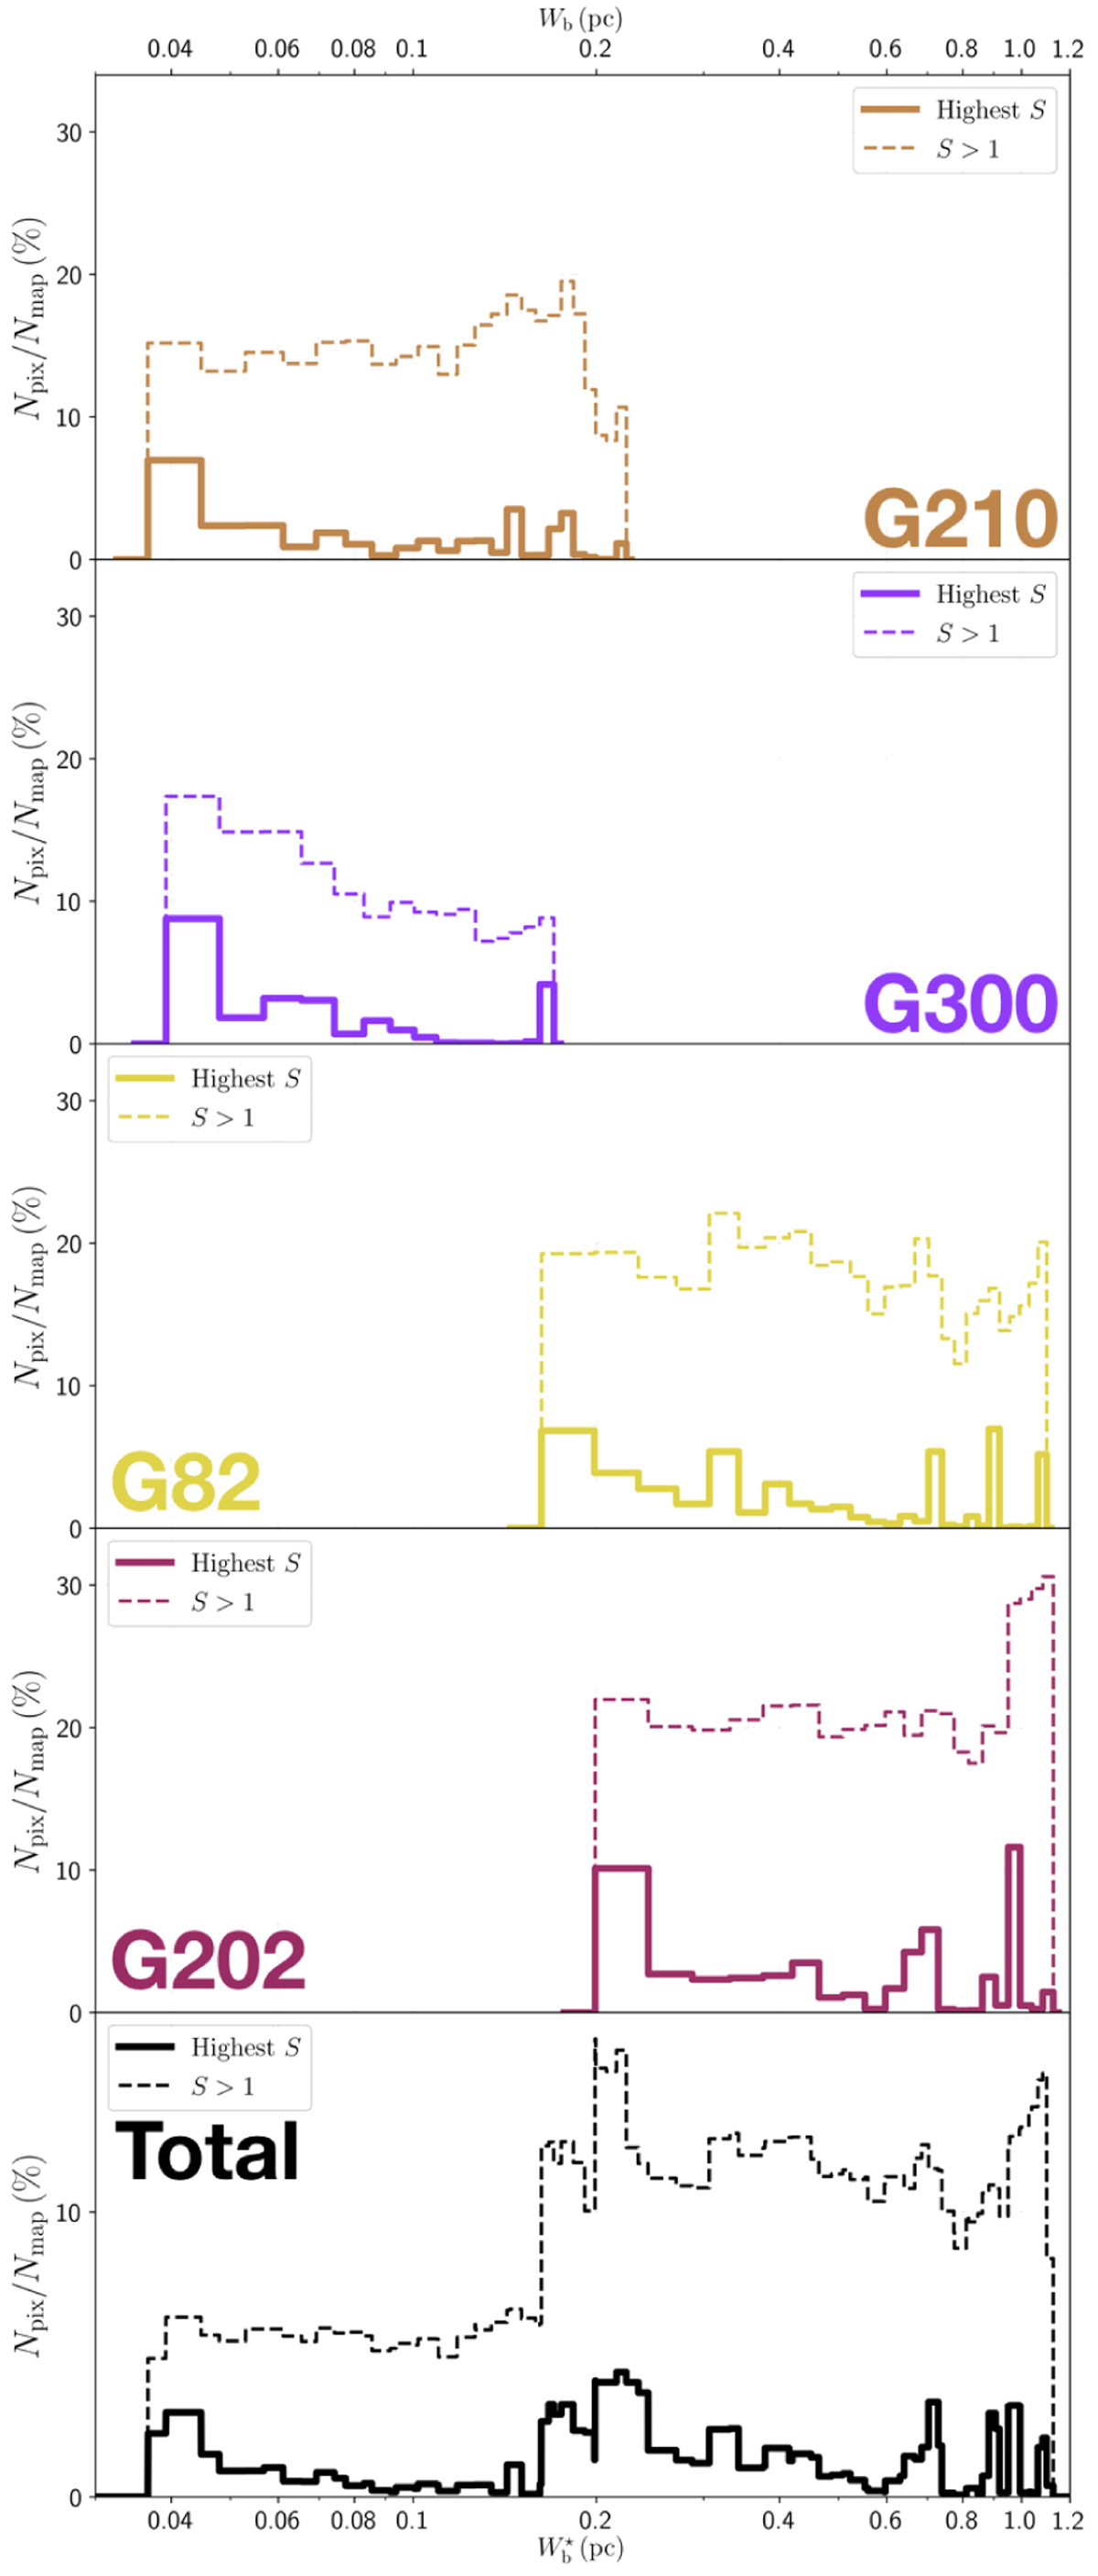
Results obtained for the bar widths in the four Herschel fields. Top four panels: histograms of bar width in the four individual Herschel fields. Bottom panel: combined histograms of the four Herschel fields together. In each panel, the solid line gives the normalized number of pixels whose most significant bar width is ![]() as a function of
as a function of ![]() , whereas the dashed line gives the normalized number of pixels belonging to a reconstructed filament of bar width Wb as a function of Wb.
, whereas the dashed line gives the normalized number of pixels belonging to a reconstructed filament of bar width Wb as a function of Wb.
Current usage metrics show cumulative count of Article Views (full-text article views including HTML views, PDF and ePub downloads, according to the available data) and Abstracts Views on Vision4Press platform.
Data correspond to usage on the plateform after 2015. The current usage metrics is available 48-96 hours after online publication and is updated daily on week days.
Initial download of the metrics may take a while.