Fig. 3
Download original image
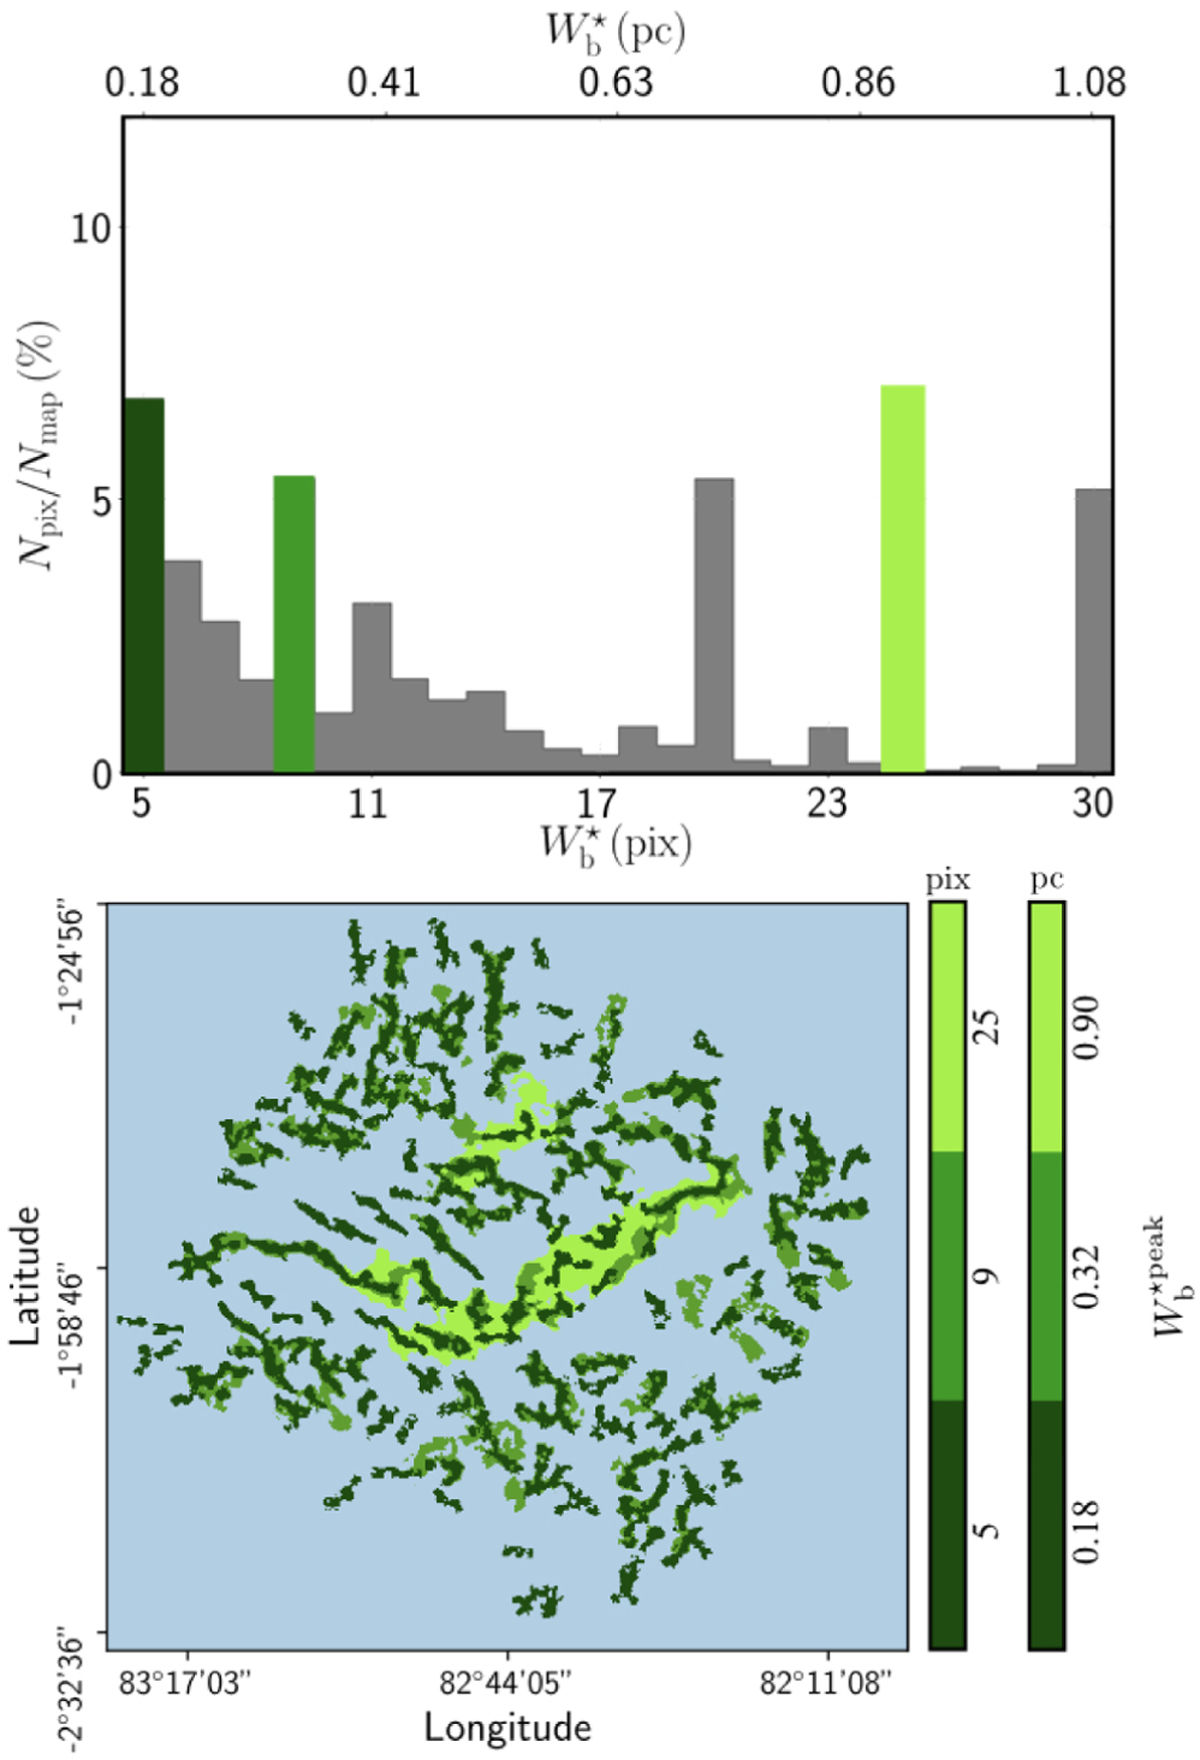
Results obtained for the bar widths in the Herschel G82 field. Top: number of pixels, Npix, whose most significant bar width is ![]() , normalized to the number of pixels in the map, Nmap, as a function of
, normalized to the number of pixels in the map, Nmap, as a function of ![]() . The peaks of the histogram correspond to the most prevalent bar widths,
. The peaks of the histogram correspond to the most prevalent bar widths, ![]() , three of which (highlighted in green) were selected for visualization. Bottom: reconstructed filaments with bar width equal to one of the three selected
, three of which (highlighted in green) were selected for visualization. Bottom: reconstructed filaments with bar width equal to one of the three selected ![]() . Smaller filaments are overlaid on top of larger filaments.
. Smaller filaments are overlaid on top of larger filaments.
Current usage metrics show cumulative count of Article Views (full-text article views including HTML views, PDF and ePub downloads, according to the available data) and Abstracts Views on Vision4Press platform.
Data correspond to usage on the plateform after 2015. The current usage metrics is available 48-96 hours after online publication and is updated daily on week days.
Initial download of the metrics may take a while.