| Issue |
A&A
Volume 668, December 2022
|
|
|---|---|---|
| Article Number | A91 | |
| Number of page(s) | 22 | |
| Section | Extragalactic astronomy | |
| DOI | https://doi.org/10.1051/0004-6361/202244465 | |
| Published online | 08 December 2022 | |
Jetted narrow-line Seyfert 1 galaxies breaking the jet paradigm: A comprehensive study of host-galaxy morphologies
1
Aalto University Metsähovi Radio Observatory, Metsähovintie 114, 02540 Kylmälä, Finland
e-mail: This email address is being protected from spambots. You need JavaScript enabled to view it.
2
Aalto University Department of Electronics and Nanoengineering, PO Box 15500, 00076 Aalto, Finland
3
European Space Agency (ESA), European Space Astronomy Centre (ESAC), Camino Bajo del Castillo s/n, 28692 Villanueva de la Cañada, Madrid, Spain
4
European Southern Observatory (ESO), Alonso de Córdova 3107, Casilla 19, Santiago 19001
, Chile
5
Finnish Centre for Astronomy with ESO (FINCA), University of Turku, Vesilinnantie 5, 20014 University of Turku, Finland
6
Dipartimento di Fisica e Astronomia “G. Galilei”, Universitá di Padova, Vicolo dell’Osservatorio 3, 35122 Padova, Italy
7
Departamento de Astronomía, Universidad de Chile, Camino del Observatorio 1515, 7591245 Las Condes, Santiago, Chile
Received:
11
July
2022
Accepted:
13
September
2022
Abstract
Narrow-line Seyfert 1 (NLS1) galaxies are unevolved active galactic nuclei (AGNs) that exist predominantly in spiral galaxies. However, mostly due to the small number of sources studied, it has been under debate whether also the hosts of jetted NLS1 galaxies, a particular subclass of these sources hosting a relativistic jet, are disk-like or elliptical, as the hosts of more powerful jetted AGNs. We studied the host morphologies of 14 NLS1 galaxies, 11 of which have been detected at 37 GHz, indicating that these sources harbour relativistic jets. The J- and Ks-band data used in this study were obtained with the Nordic Optical Telescope (NOT). We performed the photometric decomposition of the host galaxy using the band that gave a better fit and additionally created colour maps of all sources that had both a J- and a Ks-band observation. We were able to successfully model 12 sources, nine of which most likely have disk-like morphologies. Of the remaining sources, one source could possibly be hosted either in a disk-like or a dwarf galaxy, and in two cases the results are inconclusive. Only one of our sources shows clear signs of interaction, but the colour maps of most of our sources hint at ample dust in the nuclei, possibly indicating earlier minor mergers, which can go unnoticed due to the limited resolution of these observations. Our results further support disk-like galaxies as the predominant host type of jetted NLS1 galaxies. Most importantly, with the number of modelled hosts of jetted NLS1s now exceeding 50, with only a few elliptical hosts, it seems to be safe to conclude that also disk-like galaxies are able to launch and maintain relativistic jets, and that the traditional jet paradigm stating that only massive elliptical galaxies are capable of hosting relativistic jets is severely outdated.
Key words: galaxies: active / galaxies: Seyfert / galaxies: structure / infrared: galaxies
© I. Varglund et al. 2022
 Open Access article, published by EDP Sciences, under the terms of the Creative Commons Attribution License (https://creativecommons.org/licenses/by/4.0), which permits unrestricted use, distribution, and reproduction in any medium, provided the original work is properly cited.
This article is published in open access under the Subscribe-to-Open model. This email address is being protected from spambots. You need JavaScript enabled to view it. to support open access publication.
1. Introduction
Narrow-line Seyfert 1 (NLS1, Osterbrock & Pogge 1985) galaxies are a class of active galactic nucleus (AGN) principally identified from the characteristics of their optical spectra. By definition, the full width at half maximum (FWHM) of the Hβ is less than 2000 km s−1 (Goodrich 1989). Narrow-line Seyfert 1 galaxies have faint [O III] emission with respect to Hβ (F([O III]λ5007)/F(Hβ) < 3, Osterbrock & Pogge 1985). In the optical spectra, it is possible to find Fe II multiplets (Boroson & Green 1992). Narrow-line Seyfert 1 galaxies can also have blueshifted line profiles, which is indicative of outflows, though this is mostly in high-ionisation lines (e.g., Zamanov et al. 2002; Boroson 2005; Berton & Järvelä 2021).
Narrow-line Seyfert 1 galaxies are generally believed to be powered by low-mass central supermassive black holes (MBH ∼ 106 M⊙–108 M⊙; (e.g., Peterson 2011; Järvelä et al. 2015; Cracco et al. 2016; Chen et al. 2018), and therefore they are considered to be in an early evolutionary stage (Mathur 2000). Some studies suggest that the low black hole mass is due to an orientation effect Decarli et al. (2008). These studies claim that the pole-on orientation of the broad-line region (BLR) hinders the possibility of seeing Doppler broadening in the emission lines that come from the BLR. Furthermore, if the BLR is flattened, then we can only see the velocity component that points towards us, leading to the velocity vector being shortened from our point of view (e.g., Decarli et al. 2008). However, reverberation mapping campaigns suggest that the black hole masses of NLS1 galaxies are intrinsically low (e.g., Wang et al. 2016; Du et al. 2018; Du & Wang 2019). The Eddington ratio of NLS1 galaxies is high, between 0.1 and 1, or possibly even higher (Boroson & Green 1992; Marziani et al. 2018; Tortosa et al. 2022).
Narrow-line Seyfert 1 galaxies are one of the three classes of AGN known to host beamed relativistic jets (e.g., Komossa et al. 2006; Zhou et al. 2006; Yuan et al. 2008; Foschini 2011; Foschini et al. 2015; Lähteenmäki et al. 2017, 2018). The other two classes are flat-spectrum radio quasars (FSRQs) and BL Lacertae objects (BL Lacs; e.g., Abdo et al. 2009a; Foschini et al. 2010). Furthermore, NLS1 galaxies are also capable of emitting γ-rays, further proving the presence of relativistic jets (e.g., Abdo et al. 2009b; Paliya et al. 2018). This contradicts the paradigm that only galaxies with the most massive supermassive black holes (MBH > 108 M⊙) are capable of forming and maintaining fully evolved powerful relativistic jets (Laor 2000).
Of all NLS1 galaxies, only a very small percentage, ∼16%, are known to be detectable at radio frequencies (Komossa et al. 2006). Among this 16%, ∼6% are radio-quiet (R < 10) and ∼10% are radio-loud1 (R > 10; Komossa et al. 2006). All other NLS1 galaxies have yet to be detected at radio frequencies; thus, they are currently considered radio-silent. For some AGNs, the definition of radio-silent can, however, change as there have been detections of some formerly radio-silent NLS1 galaxies at 37 GHz (Lähteenmäki et al. 2018). A detection at 37 GHz strongly indicates the presence of relativistic jets. All but two of our sources, detected at 37 GHz, have multiple detections. With recurrent detections and strong variability, star formation is not a likely culprit of the radio emission. Furthermore, star formation is unable to produce radio emission at the detected flux levels at 37 GHz. The use of the radio-loudness parameter is questionable at best, since R is often calculated using non-simultaneous data, thus discounting temporal variation. In other words, it is possible for a source to be deemed radio-quiet one day and radio-loud another day. Furthermore, a relativistic jet with high inclination with respect to the line of sight can be weak due to the lack of relativistic boosting, leading to a wrong classification. Finally, a population of relativistic radio jets, almost totally absorbed at low radio frequencies and thus deemed radio-silent or -quiet, has recently emerged (Järvelä 2018; Berton & Järvelä 2021). These issues with the radio-loudness remain true even at high redshifts (Sbarrato et al. 2021). At low frequencies (< 10 GHz), a source can in some cases be classified as radio-loud even if it does not have a relativistic jet, or as radio-silent even if it does host relativistic jets. In the former case, a non-jetted source could be deemed radio-loud due to the star formation at low radio frequencies being so significant (Caccianiga et al. 2015; Ganci et al. 2019; Berton et al. 2020). In the latter case, a source with a small-scale jet may be deemed radio-silent due to the jet being completely absorbed through either synchrotron self-absorption or free-free absorption, consequently hiding the radio emission (Berton et al. 2020). Due to the ambiguity of the radio-loudness parameter, we prefer classification based on the physical properties of a source, and thus we use the terms non-jetted and jetted, the latter referring to sources that host relativistic jets.
The AGN and its host affect each other (e.g., van de Ven & Fathi 2010; Fabian 2012; Pović et al. 2012) through, for example, the regulation of the influx of gas from the host galaxy to the central black hole. The AGN has several feedback mechanisms through which it affects the host, such as jets, winds or outflows, and the ionising photons originating from the central engine. The AGN feedback can cause the star formation to either increase or decrease, depending on if the feedback is negative or positive (e.g., Carniani et al. 2016; Järvelä et al. 2018). Furthermore, extending away from the host, the circumgalactic environments can alter both the nuclear activity and the properties of the galaxy. In dense environment, major or minor mergers, as well as close encounters are more likely to occur than in less populated environments. These interactions can cause a galaxy to undergo changes, for example, in the galaxy morphology and/or its star formation. There is currently no clear consensus on how much a merger or an interaction affects the AGN activity levels. There are studies supporting no connection between nuclear action and minor or major mergers (e.g., Corbin 2000; Cisternas et al. 2011) and studies indicating that mergers do play a role in the onset of nuclear activity or the triggering of the jets (e.g., Urrutia et al. 2008; Barth et al. 2008).
The majority of non-jetted NLS1 galaxies are found in spiral galaxies (Crenshaw et al. 2003). Two of the most common features in NLS1 host galaxies are nuclear dust spirals, found in 83% of NLS1 galaxies (Deo et al. 2006), and large-scale stellar bars, found in 65% to 80% of NLS1 galaxies (Crenshaw et al. 2003). The majority of the nuclear dust spirals in NLS1 galaxies are of grand design, meaning that they have two symmetric, long, spiral arms (Deo et al. 2006). Furthermore, near the core, NLS1 galaxies are known to exhibit increased star formation (Sani et al. 2010; Winkel et al. 2022).
Earlier host galaxy studies have focused on either large-sample studies or individual source analyses, with a majority of the earlier studies being on the individual side (Krongold et al. 2001; Antón et al. 2008; Orban de Xivry et al. 2011; Mathur et al. 2012; León Tavares et al. 2014; Kotilainen et al. 2016; D’Ammando et al. 2017; D’Ammando et al. 2018; Olguín-Iglesias et al. 2017, 2020; Järvelä et al. 2018; Berton et al. 2019; Hamilton et al. 2021). The studies with large samples have had sample sizes varying from roughly ten to roughly 30 NLS1 galaxies and they target mostly non-jetted NLS1 galaxies. All of the individual source analysis studies have been on jetted NLS1 galaxies, with ∼70% of the sources being interacting. Nearly all of the studied NLS1 galaxies have been identified as disk-like, with only a few cases of elliptical hosts (D’Ammando et al. 2017; D’Ammando et al. 2018). Furthermore, a couple of large sample studies have taken a look at the possible connection between interaction and powerful relativistic jets. The previous studies highlight the possibility of interaction being a key driving factor of relativistic jets in NLS1 galaxies (e.g., Järvelä et al. 2018; Olguín-Iglesias et al. 2020). Olguín-Iglesias et al. (2020) speculated that in γ-ray-emitting NLS1 galaxies nuclear activity is caused by minor mergers, while the nuclear activity behind radio-loud non-γ NLS1 galaxies is due to secular evolution. Furthermore, the evolution of NLS1 galaxies has been hypothesised to be at least a partial cause of the heterogeneity of the NLS1 population. This theory is supported by studies that have found that the jetted NLS1 galaxies favour denser large-scale environments compared to their non-jetted counterparts (Järvelä et al. 2017, 2018). With NLS1 galaxies being predominantly located in spiral galaxies or mergers of spiral galaxies, several host galaxy studies have argued against the current jet paradigm that claims that only old elliptical galaxies are capable of harbouring powerful relativistic jets (Järvelä et al. 2018; Berton et al. 2019; Olguín-Iglesias et al. 2020).
In this work, we studied the morphology of 14 NLS1 galaxies, 11 of which have been detected at 37 GHz and are considered jetted. Six of the sources have been detected at 1.4 GHz in the Faint Images of the Radio Sky at Twenty-Centimeters (FIRST) survey. In an upcoming paper, we will expand the sample by analysing new data of Southern NLS1 galaxies obtained with the Magellan telescopes. The cosmological parameters used in this paper are H0 = 73 km s−1 Mpc−1, Ωmatter = 0.27 and Ωvacuum = 0.73 (Spergel et al. 2007). In Sect. 2, we go through the sample selection, the observations, and the data reduction. The data analysing process is described in Sect. 3. The results for each individual source with a successful fit can be found in Sect. 4 and are discussed in Sect. 5. The two galaxies that we were unable to fit can be found in Appendix A.
2. Observations and data reduction
Our original sample included all NLS1 galaxies detected in γ-rays or at 37 GHz at ∼Jy levels, making them likely to host relativistic jets, that were observable from La Palma during the semester of our observations (Oct. 2019–Mar. 2020, proposal ID 60-005, PI E. Järvelä). Based on our earlier experience with NOTCam, we applied a redshift cut of z < 0.6 to ensure good quality data, and excluded sources which have published results. After applying these criteria, we were left with a total of 20 jetted NLS1 galaxies. Some observing time was lost due to cloudy weather, and in the end we were able to observe only 11 sources from the original sample. In addition, strong dusty wind forced us to observe towards a certain direction for extended periods of time, and due to the lack of small RA sources in our original sample, we instead observed one source from Lähteenmäki et al. (2017) and two sources from the Southern NLS1 sample by Chen et al. (2018), which were then included in the sample. The 37 GHz detection values are all from the Metsähovi Radio Observatory AGN monitoring programme. All but one value is an unpublished and thus new value. Furthermore, one of our sources, SDSS J093712.32+500852.1, has been detected at γ-rays. The detection was made with the Large Area Telescope of the Fermi Gamma-ray Space Telescope.
Table 1 lists the properties of our sample as well as some basic characteristics of the observations. The observations were carried out with the Nordic Optical Telescope (NOT) near-infrared Camera (NOTCam) over five nights, from February 7 to February 12, 2020. We observed the full sample with NOTCam wide-field (WF) mode. The CCD in NOTCam is 1024×1024 pixels. The field of view (FOV) of wide-field imaging is 4′ × 4′, giving a scale of 0.234″ px−1. The weather during our observations was challenging, as discussed earlier.
Basic properties of the sample and the observations.
We used the frame mode and nine-point dithering. The dithering step was 10″and the skew was 2″. We observed all but one source (SDSS J102906.68+555625.2) in both the J and Ks bands. The total exposure time for each source can be found in Table 1. For some sources, a bright point spread function (PSF) star was observed in both bands (for details of the PSF stars, see Sect. 3).
We used the IRAF NOTCam data reduction package2. First, we combined the dithered images to obtain one image for each dithering sequence. After that, we combined the dithered images of one night to produce one final image. This was done for each filter. We omitted observations where the seeing was very bad or clearly worse than in the other observations to obtain the best possible final image. For the sources for which a PSF star had been observed, the data reduction and the image combination process was the same. The final data reduction step was to calculate a zero point magnitude for all the images. This was done by using the Graphical Astronomy and Image Analysis Tool3 (Gaia). To obtain a zero point magnitude, we compared the magnitude of stars in the 2MASS catalogue to values we obtained from our images using Gaia. When also taking into account the exposure time, we were able to obtain a zero point magnitude.
3. Data analysis
The following images and results presented in this paper are the results for the band with which we were able to obtain a better fit. In most cases, this meant the observation with the better seeing. In some cases, the seeing was so similar that the changes to the image quality were low. We used GALFIT version 3 (Peng et al. 2010) to complete a 2D photometric decomposition of our images. With GALFIT we were able to complete a photometric decomposition for all of our images. The first thing to take into account with GALFIT is having a properly modelled PSF. With a good PSF it is possible to remove the contamination caused by the AGN, whereas a bad PSF will not model the AGN contamination properly, making it impossible to achieve an accurate model for the host galaxy.
We used three different PSF techniques to obtain the best possible PSF. In the first technique, we searched for bright, isolated and not saturated stars in the FOV of each image. If such a star was present, we extracted a ∼100×100 pixel image (the same size used to extract a cutout around the target galaxy), and we subtracted the background by averaging the measurements obtained in eight different locations of the cutout and used it as a model of the PSF. In the second technique, if a specific PSF star had been observed, we extracted a cutout of this star otherwise using the same procedure as in the first technique. The third PSF technique was to use the DAOPHOT package in IRAF (Stetson 1987) to build a detailed model of the PSF using a list of suitable PSF stars chosen from a 3D plot. When using DAOPHOT, there is no need to subtract the background sky as it has been subtracted during the PSF building process. We always chose the PSF technique that gave us the best fit of the star profile. The fitting process was the same for all sources.
The first fit we did on any given source was a clean PSF fit, with the PSF as the only component being fitted. After visual inspection of the residuals of the PSF fit, we made a decision on whether or not more components were needed. Each new component was added one at a time, inspecting the residuals after each successful run to determine once again if more components were needed. We also followed how the reduced χ2 value changed with the component additions. The initial fitting parameters were varied to ensure that the values the fit was converging to were correct and stable. We also varied the number of components to obtain the best, most reasonable result. We used two different types of components to obtain the best fit: PSF and a Sérsic profile. The Sérsic profile can be given as
![Mathematical equation: $$ \begin{aligned} I(r) = I_\text{e} \mathtt {exp} \Bigg [ -\kappa _n \Bigg ( \bigg ( \frac{r}{r_\text{e}} \bigg )^{1/n} -1 \Bigg ) \Bigg ] , \end{aligned} $$](/articles/aa/full_html/2022/12/aa44465-22/aa44465-22-eq1.gif) (1)
(1)
where I(r) is the surface brightness at radius r, Ie is the surface brightness at half-light radius, re, and κn is a parameter related to the Sérsic index, n (Graham & Driver 2005).
We chose the Sérsic profile for fitting because of its versatility. By changing the Sérsic index, it is possible to model both elliptical and disk-like light distributions as well as classical bulges and pseudo-bulges. Common key Sérsic indices are n = 0.5, 1, and 4. A Gaussian profile can be obtained with n = 0.5. An exponential profile, often used for modelling disks, can be obtained with n = 1. A de Vaucouleurs profile, often used to model the light distribution of elliptical galaxies, can be obtained with n = 4. Smaller Sérsic indices typically indicate both a disk-like morphology and pseudo-bulges of galaxies. In these cases, the core flattens more rapidly at r < re and the intensity decreases quicker at r > re (Fisher & Drory 2008). However, even if Sérsic indices of n = 1 and n = 2 typically model disks and pseudo-bulges, respectively, spiral galaxies have been proven to exhibit a range of Sérsic indices, often varying from approximately 0.2 to approximately 3, with some spiral galaxies even having Sérsic indices as high as 4 (e.g., Elmegreen & Elmegreen 2014; Salo et al. 2015).
With the exception of the sky background parameter, all parameters were kept unfrozen to maintain as unbiased a fit as possible. The sky background was estimated by picking several evenly distributed blank locations in the sky and calculating the average value of the sky background in them. To obtain the best results, we maintained as large of a cutout as we possibly could. In a few cases there were some other nearby sources inside the cutout. In these cases, we fitted the secondary sources as well. The goodness of fit was determined through a numerical and a visual inspection as well as through ensuring that the obtained parameters were logical and reasonable. The visual inspection meant looking at the residuals and trying to determine if everything had been properly fitted. Numerical inspection meant studying the reduced  parameter. If the
  parameter was significantly larger than one or less than one, we did not accept the fit and continued the fitting procedure until we received a value close to one.
After obtaining a satisfactory fit, we extracted the radial surface brightness profiles. We extracted the profile from the observed image, the model image, and the separate component images. We used the IRAF task ELLIPSE for the extraction, setting the values of the different parameters recovered from GALFIT as initial values for the process. For the radial surface brightness profiles of the model and observed images, we used the same initial values to ensure similar radii of the ellipses. The other components had, in most cases, unique initial values compared to the model and observed image initial values. After a successful run, we plotted the results for each source, including all the possible components of the given source, into one figure.
To account for the minor change induced by the sky variation to the Galfit results we ran a ±1σ value fit for all the sources. This gave us the errors for the surface brightness at the half-light radius, re, the Sérsic index, n, the axial ratio, and the position angle (PA). For the magnitude, we used error propagation for determining the error since we had three error sources: sky error, 2MASS catalogue error, and the zero-point magnitude error. These errors have been taken into account when plotting the results from ELLIPSE. Individual component errors, taking into account all error sources, can be found in the best-fit parameter tables of each individual source.
We also created colour maps of all sources that had both J- and Ks-band observations. The only source that we do not have a colour map of is SDSS J102906.68+555625.2. Due to the PSF of the J- and Ks-band images having different widths, we convolved the image with a smaller PSF with a Gaussian of a tailored size to try and get the PSF of both images to be of the same size. We obtained a satisfying result for all but SDSS J150916.18+613716.7. For this source, a simple convolution with a Gaussian was not enough to correct the issue with the PSF sizes. For the other sources, we were able to obtain physically correct colour maps. We have presented the colour map of SDSS J150916.18+613716.7 in this paper, and when analysing it, we have taken into account the issue with the PSF sizes.
4. Individual source analysis
4.1. 6dFGS gJ042021.7-053054
This source was detected at 37 GHz at an ∼1 Jy level (see Table 2), indicating the presence of relativistic jets. There are no earlier radio detections.
Radio properties of the sample, and the black hole mass estimates.
We opted to manually select a PSF star from the image to have the best possible quality. The best fit for this source is presented in Table 3, with one PSF and one Sérsic component. Based on the best fit parameters, the component fitted with a Sérsic function is likely a disk (n =  ). There were two sources close to this target. These two sources were modelled successfully with one PSF component each.
Best-fit parameters of 6dFGS gJ042021.7−053054.  =
=  .
.
The observed, model, and residual images of the source can be seen in Fig. 1. We had some residuals left, but the  value is good. The residuals left in the image do not directly hint to any specific component being missing, and it is entirely possible that they are noise. However, it is also possible that the remaining residuals are remains of a ring-like structure. The axial ratio of approximately 1 supports this theory. The ring structure is also visible in the observed image. Adding more Sérsic components did not improve the results and would not have been physically justifiable.
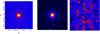 |
Fig. 1. J-band images of 6dFGS gJ042021.7-053054. The FoV is 23.4″/74.1 kpc in all images. Left panel: observed image. Middle panel: model image. Right panel: residual image smoothed over 3 px. |
The radial surface brightness profile is presented in Fig. 2. The model and galaxy curves in the plot are nearly identical, suggesting that our fit obtained with GALFIT is good. The J − Ks colour map of the source is shown in Fig. 3. In general, the magnitude difference between J and Ks magnitudes is approximately between 0 and 2.5 for Seyfert galaxies (Jarrett 2000). With this in mind, the colour map presented here is in agreement with what is expected to be seen in a Seyfert 1 galaxy. Furthermore, galaxies with a difference in the J and Ks magnitude of more than 1.3 are considered very red. On average, the red colour in AGNs is typically dust extinction. The size of the galaxy is very small; however, the colour of the central region indicates a possibility of dust extinction. The map also suggest a possible bar structure. Otherwise, the colours of the galaxy are mostly uniform.
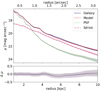 |
Fig. 2. Radial surface brightness profile plot of 6dFGS gJ042021.7−053054. The galaxy component is plotted with a blue line, the model component is plotted with a dashed red line, the PSF component is plotted with a dotted green line, and the Sérsic component is plotted with a dashed pink line. The shaded area surrounding each profile curve depicts the error linked to each component. |
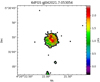 |
Fig. 3. J − Ks colour map of 6dFGS gJ042021.7-053054. |
4.2. FBQS J0744+5149
Despite earlier radio detections at 1.4 GHz, this source has not been detected at 37 GHz (Lähteenmäki et al. 2017). Observations with the Karl. G Jansky Very Large Array (JVLA) at 5 GHz (Berton et al. 2018) show an unresolved steep core, with total luminosity comparable to compact steep-spectrum (CSS) sources. We observed it as an extra due to the weather constraints mentioned in Sect. 2.
We used DAOPHOT to obtain the best possible PSF. The best fit was obtained with one PSF and two Sérsic components; the corresponding best-fit parameters can be found in Table 4. Based on the parameters of the Sérsic 1 component, such as its unusually small axial ratio ( ) and the effective radius (
 kpc) that is considerably smaller than the seeing disk, we believe that this component is not fully resolved, which might be due to the moderately high redshift of this source, or an incomplete PSF model. The Sérsic 2 seems to favour a disk-like morphology, rather than an elliptical morphology; however, this component might not be fully resolved. The galaxy seems to be very small, with an effective radius of roughly 2 kpc. However, this would be quite low even for a disk-like galaxy, so we cannot rule out that the host is some kind of a dwarf galaxy. FBQS J0744+5149 has the highest black hole mass in the whole sample, exceeding 108 M⊙. This seems to be in contradiction with the small size of its host. However, the black hole mass was originally estimated using magnitudes (Foschini et al. 2017) that are not as accurate as the more commonly used methods, such as those based on the continuum luminosity and the emission line widths, so the estimate might not be very reliable.
Best-fit parameters of FBQS J0744+5149.  .
.
The observed, model, and residual images of the source can be seen in Fig. 4. Based on the very clean residuals and the good reduced  value, it seems that the galaxy has been nearly completely modelled. The radial surface brightness profile is presented in Fig. 5. In the plot, the model and galaxy curves are nearly identical, which supports the idea of our GALFIT fit being good. The J − Ks colour map of the source is displayed in Fig. 6. The J − Ks magnitude is ∼1.5, and thus the galaxy can be deemed as extremely red. The colours in the central region suggest possible dust extinction. The difference in the J and Ks magnitude is within the accepted range for a Seyfert 1 galaxy.
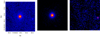 |
Fig. 4. J-band images of FBQS J0744+5149. The FoV is 15.0″/84.6 kpc in all images. Left panel: observed image. Middle panel: model image. Right panel: residual image smoothed over 3 px. |
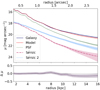 |
Fig. 5. Radial surface brightness profile plot of FBQS J0744+5149. The galaxy component is plotted with a blue line, the model component is plotted with a dashed red line, the PSF component is plotted with a dotted green line, the Sérsic 1 component is plotted with a dashed pink line, and finally the Sérsic 2 component is plotted with a dotted light blue line. The shaded area surrounding each profile curve depicts the error linked to each component. |
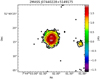 |
Fig. 6. J − Ks colour map of FBQS J0744+5149. |
4.3. SDSS J080535.16+302201.7
This jetted source, detected at 1.4 GHz, can be fairly bright (approximately 1.4 Jy when flaring) also at 37 GHz (see Table 2). For this source, we were able to locate an isolated star directly from the image for the PSF model. We obtained the best fit with one PSF and one Sérsic component, which are presented in Table 5.
Best-fit parameters of SDSS J080535.16+302201.7.  .
.
The observed, model, and residual images of the source can be seen in Fig. 7. Some leftover residuals are visible. We tried various approaches but could not obtain a physically meaningful fit that would have modelled the residuals completely. It is possible that some of the residuals that remain on the southern side of the source are due to a background source. Based on the best-fit parameters, the host galaxy is most likely disk-like due to the low Sérsic index (n =  ). The best fit parameters and the residuals indicate that we have modelled the whole galaxy. Since there was a second source close to our target, we used one PSF to model that one to obtain as clean a residual image as possible.
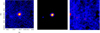 |
Fig. 7. J-band images of SDSS J080535.16+302201.7. The FoV is 23.4″/145.6 kpc in all images. Left panel: observed image. Middle panel: model image. Right panel: residual image smoothed over 3 px. |
The radial surface brightness profile can be found in Fig. 8. The curves of the model and observed image are very similar, with minor deviation towards the higher radii. The deviation could possibly be explained by the residuals remaining southward of the galaxy; however, we cannot say if the deviation is related to our source or a background or foreground object. The curves give us a strong reason to believe that our best fit is good. The J − Ks colour map of the source is shown in Fig. 9. The angular size of the galaxy is very small due to the high redshift, and therefore its structure is difficult to distinguish. The galaxy has a J − Ks colour of about 1.5 and thus counts as a very red galaxy.
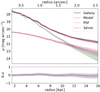 |
Fig. 8. Radial surface brightness profile plot of SDSS J080535.16+302201.7. The galaxy component is plotted with a blue line, the model component is plotted with a dashed red line, the PSF component is plotted with a dotted green line, and the Sérsic component is plotted with a dashed pink line. The shaded area surrounding each profile curve depicts the error linked to each component. |
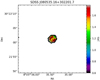 |
Fig. 9. J − Ks colour map of SDSS J080535.16+302201.7. |
4.4. SDSS J084516.17+421129.9
There are no previous radio detections of SDSS J084516.17+421129.9, however, it has been detected at 37 GHz (see Table 2) and is therefore considered jetted.
We obtained the best PSF with DAOPHOT. The best fit was achieved with one PSF and one Sérsic; the corresponding parameters are listed in Table 6. The Sérsic index, n =  , suggests a disk-like morphology. Due to the effective radius being so large, we believe that we have fitted the whole galaxy at once. We fitted a PSF model on two nearby sources, to obtain as clean residuals as possible. Our PSF model was able to completely model the two sources. Due to this, it is possible that the two nearby sources are stars. The nearby sources are very faint, with magnitudes fainter than 18 mag, and thus they are quite invisible in the plots.
Best-fit parameters of SDSS J084516.17+421129.9.  =
=  .
.
The observed, model, and residual images of the source are presented in Fig. 10. The residuals are nearly non-existent and in combination with a good reduced  value support a good fit. The radial surface brightness profile can be seen in Fig. 11. The curves of the model and observed image are very similar, with some slight deviation near the higher radii. The similarity in the curves supports the idea of a good fit. The J − Ks colour map of the source is shown in Fig. 12. The difference in the J − Ks magnitude is on the upper-end of generally accepted Seyfert 1 galaxies, but still remains inside the range. With the galaxy being on the upper end of the range, it counts as very red.
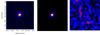 |
Fig. 10. Ks-band images of SDSS J084516.17+421129.9. The FoV is 5.9″/35.5 kpc in all images. Left panel: observed image. Middle panel: model image. Right panel: residual image smoothed over 3 px. |
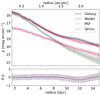 |
Fig. 11. Radial surface brightness profile plot of SDSS J084516.17+421129.9. The galaxy component is plotted with a blue line, the model component is plotted with a dashed red line, the PSF component is plotted with a dotted green line, and the Sérsic component is plotted with a dashed pink line. The shaded area surrounding each profile curve depicts the error linked to each component. |
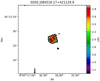 |
Fig. 12. J − Ks colour map of SDSS J084516.17+421129.9. |
4.5. SDSS J090113.23+465734.7
This source has previously been detected at 1.4 GHz, and it has also been detected at 37 GHz (see Table 2). We created the best PSF model with DAOPHOT and then obtained the best fit with one PSF and one Sérsic component. The best-fit values can be found in Table 7. The result suggests that we are most likely modelling the whole galaxy. The Sérsic index, n =  , is low for a disk and closer to values usually associated with bars, but it rules out an elliptical morphology. We also fitted a PSF on a nearby source. The PSF modelled the very faint nearby source completely. Due to the faintness of the source, the nearby source is virtually invisible in the intensity plots.
Best-fit parameters of SDSS J090113.23+465734.7.  =
=  .
.
The observed, model, and residual images of the source can be seen in Fig. 13. There are only minor residuals and the reduced  value of our best fit is acceptable. Based on the residuals and the best-fit parameters, especially the high effective radius, we believe that we are modelling the entire galaxy at once. The radial surface brightness profile can be found in Fig. 14. The observed image and model have very similar radial surface brightness profile curves. For the lower radii, the curves are nearly identical. There is some larger deviation towards the higher radii. Our results suggest that the best fit that we have obtained is good. The J − Ks colour map of the source is shown in Fig. 15. Due to the small size of the galaxy, we cannot say anything about the structure. The colours are otherwise in line with what is expected.
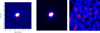 |
Fig. 13. Ks-band images of SDSS J090113.23+465734.7. The FoV is 5.9″/31.8 pc in all images. Left panel: observed image. Middle panel: model image. Right panel: residual image smoothed over 3 px. |
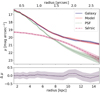 |
Fig. 14. Radial surface brightness profile plot of J090113.23+465734.7. The galaxy component is plotted with a blue line, the model component is plotted with a dashed red line, the PSF component is plotted with a dotted green line, and the Sérsic 1 component is plotted with a dashed pink line. The shaded area surrounding each profile curve depicts the error linked to each component. |
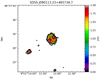 |
Fig. 15. J − Ks colour map of J090113.23+465734.7. |
4.6. SDSS J093712.32+500852.1
This source has been detected at 1.4 and 37 GHz (see Table 2), indicating the presence of a jet. This source is the only one of our sources that has also been detected at γ-rays (Romano et al. 2018).
For the PSF model, we used a suitable star from the same image as the source. The best fit was obtained with one PSF and one Sérsic function, and the corresponding fit values can be found in Table 8. The Sérsic function shows properties of both a bulge and a bar component, possibly fitting a combination of the two. Our belief stems from the best fit parameters, especially the small half-light radius and the colour map. We also fitted a PSF on a nearby source, to have as clean residuals as possible. The PSF modelled the nearby source well, thus suggesting that our PSF model was good.
Best-fit parameters of SDSS J093712.32+500852.1.  =
=  .
.
The observed, model, and residual images of the source can be seen in Fig. 16. There are some residuals left, on both sides of the galaxy. If the Sérsic component modelled the bulge-bar combination, it would indicate that the residuals are from the disk component that we were unable to model. Either way, the results point to this galaxy having at least a bar, and most probably disk-like morphology.
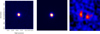 |
Fig. 16. Ks-band images of SDSS J093712.32+500852.1. The FoV is 5.9″/23.7 kpc in all images. Left panel: observed image. Middle panel: model image. Right panel: residual image smoothed over 3px. |
The reduced  value is at the higher end of our sample, however the value is still good. The radial surface brightness profile can be seen in Fig. 17. The model and observed images curves are, as can be guessed from the reduced
  value, are slightly different. The J − Ks colour map of the source is shown in Fig. 18. The colour map supports the results of the modelling, as a bar-like structure, with a PA similar to the Sérsic component, can be seen. The colour map is within the acceptable range for a Seyfert 1 galaxy.
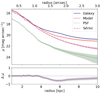 |
Fig. 17. Radial surface brightness profile plot of SDSS J093712.32+500852.1. The galaxy component is plotted with a blue line, the model component is plotted with a dashed red line, the PSF component is plotted with a dotted green line, and the Sérsic component is plotted with a dashed pink line. The shaded area surrounding each profile curve depicts the error linked to each component. |
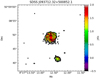 |
Fig. 18. J − Ks colour map of SDSS J093712.32+500852.1. |
4.7. SDSS J102906.68+555625.2
This source is a jetted NLS1, only detected at 37 GHz (see Table 2). The detection at a high radio frequency strongly suggests the presence of powerful relativistic jets. Due to the aforementioned issues with the observations, we only observed this source in the Ks-band. The observations of this source struggled with the worst seeing of any of our observations. Nearly half of the exposures were deemed unusable due to significantly higher seeing.
We used DAOPHOT to model our PSF. The best fit values can be found in Table 9. The components fitting the galaxy are reasonable, but the error in the Sérsic index is relatively high (∼+2). Due to the error, our findings are inconclusive regarding the morphology. We suspect that the error of the Sérsic index, n =  , is due to the turbulent sky that resulted in poor seeing. The effective radius is 2.14 kpc, and thus the Sérsic index might not be fully resolved. A nearby source was modelled completely with a single PSF.
Best-fit parameters of SDSS J102906.68+555625.2.  =
=  .
.
The observed, model, and the residual image of the source can be seen in Fig. 19. The reduced  value is good and there are no visible residuals left. The radial surface brightness profile is in Fig. 20. The light curves for all but the PSF have small errors and even the error in the PSF is acceptable. We have no colour map of this galaxy; however, due to the small size of the galaxy and the high redshift, the colour map would most likely not have helped us to determine the morphology or any components of the galaxy.
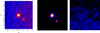 |
Fig. 19. Ks-band images of SDSS J102906.68+555625.2. The FoV is 8.4″/47.0 kpc in all images. Left panel: observed image. Middle panel: model image. Right panel: residual image smoothed over 3px. |
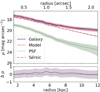 |
Fig. 20. Radial surface brightness profile plot of SDSS J102906.68+555625.2. The galaxy component is plotted with a blue line, the model component is plotted with a dashed red line, the PSF component is plotted with a dotted green line, and the Sérsic component is plotted with a dashed pink line. The shaded area surrounding the profile curve depicts the error linked to the component. |
4.8. SDSS J103123.73+423439.2
Previously detected at 1.4 GHz, this source has also been detected at 37 GHz (see Table 2). According to Berton et al. (2018), who observed the object with the JVLA at 5 GHz, the source could probably be considered as a CSS source, due to its compact structure.
A visual inspection of this source suggests that the morphology is elongated. The PSF model was created with DAOPHOT. The best fit was obtained with one PSF and one Sérsic function. The best-fit values can be found in Table 10. Based on the best-fit parameters, we believe that we have modelled the whole galaxy with these functions. This is supported by the effective radius being of a reasonable size for a galaxy with disk-like morphology. Though the Sérsic index, n =  , is on the higher side for disk-like galaxies, the elongated morphology still suggests disk-like morphology.
Best-fit parameters of SDSS J103123.73+423439.2.  =
=  .
.
The observed, model, and residual images of the source can be seen in Fig. 21. The residual image is very clean, with little to no residuals visible in the image. The residuals and the reduced  value suggest that the source has been modelled well. This is supported by the model and observed image radial surface brightness profiles, seen in Fig. 17, being nearly identical. In the radial surface brightness profile (Fig. 22) the Sérsic curve is very close to the model and observed image curves, dominating the overall light profile and indicating that the AGN is quite faint. The PSF curve has a relatively large error towards the higher radii, due to it being near the sky level. The J − Ks colour map of the source is shown in Fig. 23. This is another very small galaxy and its structure cannot be determined from this colour map. In general it is in agreement with what is expected to be seen in a Seyfert 1 galaxy.
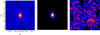 |
Fig. 21. Ks-band images of SDSS J103123.73+423439.2. The FoV is 23.4″/117.1 kpc in all images. Left panel: observed image. Middle panel: model image. Right panel: residual image smoothed over 3 px. |
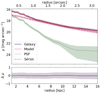 |
Fig. 22. Radial surface brightness profile plot of SDSS J103123.73+423439.2. The galaxy component is plotted with a blue line, the model component is plotted with a dashed red line, the PSF component is plotted with a dotted green line, and the Sérsic component is plotted with a dashed pink line. The shaded area surrounding each profile curve depicts the error linked to each component. |
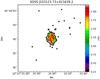 |
Fig. 23. J − Ks colour map of SDSS J103123.73+423439.2. |
4.9. SDSS J122844.81+501751.2
This source has been detected at 37 GHz (see Table 2); however, there are no other detections in the radio regime. Based on visual inspection, it appears that there is another source seemingly close to our galaxy. However, without a spectrum of the possible companion, it is impossible to say if it is at the same redshift as our source, or instead a background or a foreground source. The morphologies of the two sources seem undisturbed, indicating that if they are at the same redshift and any interaction has not taken place yet. We reference to this source as tail in the best-fit parameter table, Table 11. A separate PSF star gave us the best PSF. We obtained the best-fit values with one PSF and two Sérsic functions. Based on a visual analysis of the model of Sérsic 1, it appears that the function mainly models the companion; however, it is possible that the function also models a the western part of the main galaxy. The Sérsic index of the companion, nSérsic 1 =  , suggests a disk-like morphology. Sérsic 2, modelling the NLS1, has an index of nSérsic 2 =
  and an effective radius of 1.15 kpc, indicating that it may represent a bulge component, which, however, might not be fully resolved. There was a nearby source that required two components, a PSF and a Sérsic, to be modelled completely.
Best-fit parameters of SDSS J122844.81+501751.2.  =
=  .
.
The observed, model, and residual images of the source can be seen in Fig. 24. Residuals can be seen on the east side of the galaxy. They could be due to the fact that the Sérsic 1 component, which mostly models the companion, has quite a large effective radius, in practice also modelling the western part of the NLS1 host. However, since it is not concentric with the NLS1, it also creates a gradient overlaying the NLS1 host, which is probably why we were not able to model the possible disk of the NLS1 host. If the tail is a genuine part of the system, then it is possible that this is an interacting source.
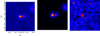 |
Fig. 24. Ks-band images of SDSS J122844.81+501751.2. The FoV is 23.4″/91.5 kpc in all images. Left panel: observed image. Middle panel: model image. Right panel: residual image smoothed over 3 px. |
The radial surface brightness profile can be seen in Fig. 25. As can be seen in the plot, the errors remain steady through each curve throughout the entire plot. The observed image and model image curves are very similar. The J − Ks colour map of the source is shown in Fig. 26. The galaxy has a very large red area in the colour map, reaching all the way to the edge. The structure of the galaxy is not distinguishable from the colour map. The nearby source can be seen in the right-hand corner of the colour map. Our source of interest has a colour map that is in line with what is expected in a Seyfert 1 galaxy. With the difference in the J and Ks magnitude being above 1.3 for the AGN, this counts as very red with the red possibly signifying dust extinction.
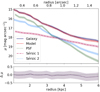 |
Fig. 25. Radial surface brightness profile plot of SDSS J122844.81+501751.2. The galaxy component is plotted with a blue line, the model component is plotted with a dashed red line, the PSF component is plotted with a dotted green line, the Sérsic 1 component is plotted with a dashed pink line, and finally the Sérsic 2 component is plotted with a dotted light blue line. The shaded area surrounding each profile curve depicts the error linked to each component. |
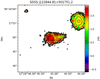 |
Fig. 26. J − Ks colour map of SDSS J122844.81+501751.2. |
4.10. SDSS J123220.11+495721.8
The detection at 37 GHz suggests the presence of a relativistic jet in this source (see Table 2); however, there are no other radio detections. We used DAOPHOT to obtain a good PSF model. We obtained the best fit with one PSF and two Sérsic functions. The best-fit values can be found in Table 12, suggesting disk-like morphology. Based on the best-fit parameters of Sérsic 1, it is possible that Sérsic 1 is not fully resolved. This is supported by the fact that the axial ratio is almost zero.
Best-fit parameters of SDSS J123220.11+495721.8.  =
=  .
.
The observed, model, and residual images of the source can be seen in Fig. 27. The residual image is quite clean, with only slight residuals remaining. The reduced  value is very good. The radial surface brightness profile can be seen in Fig. 28. The model and observed image curves are nearly identical throughout the entire plot, and the errors are very small. The J − Ks colour map of the source is shown in Fig. 29. The map displays a bar-like structure near the central region of the galaxy, however, it is also possible that this structure is simply caused by dust extinction.
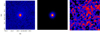 |
Fig. 27. Ks-band images of SDSS J123220.11+495721.8. The FoV is 23.4″/91.3 kpc in all images. Left panel: observed image. Middle panel: model image. Right panel: residual image smoothed over 3 px. |
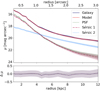 |
Fig. 28. Radial surface brightness profile plot of SDSS J123220.11+495721.8. The galaxy component is plotted with a blue line, the model component is plotted with a dashed red line, the PSF component is plotted with a dotted green line, the Sérsic 1 component is plotted with a dashed pink line, and finally the Sérsic 2 component is plotted with a dotted light blue line. The shaded area surrounding each profile curve depicts the error linked to each component. |
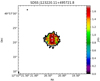 |
Fig. 29. J − Ks colour map of SDSS J123220.11+495721.8. |
4.11. SDSS J125635.89+500852.4
This galaxy has been detected at 1.4 GHz in the past, and it has also been detected at 37 GHz (see Table 2). We used a DAOPHOT PSF for the fitting. The best fit was achieved with one PSF and one Sérsic function. The best-fit values can be found in Table 13. The parameters of the Sérsic function suggest that we are modelling the entire galaxy at once. Because the errors show significant deviation in the Sérsic index, n = 2.46 , we do not find our results conclusive on the morphology of the source. We also fitted a PSF to a nearby source to obtain as clean residuals as possible. This modelled the nearby source completely and is therefore a good indicator that our PSF model is accurate.
Best-fit parameters of SDSS J125635.89+500852.4.  =
=  .
.
The observed, model, and residual images of the source can be seen in Fig. 30. The residual image is clean, with only very small residuals remaining, and the reduced  value is very good. The best fit parameters suggest that all of the components are fully resolved. The radial surface brightness profile can be seen in Fig. 31. The model and observed image curves are very similar, although not identical. The J − Ks colour map of the source is shown in Fig. 32. With the J − Ks magnitude being near 2, this is a very red, but small galaxy. The red region near the nucleus suggests there is a bar, which is due to the red region of the source reaching all the way out to the sides of the galaxy and not just being located at the core of the source. Due to this, it is possible that the host has disk-like morphology. In general, the structure is in line with the current expectations of Seyfert 1 galaxies.
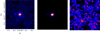 |
Fig. 30. Ks-band images of SDSS J125635.89+500852.4. The FoV is 23.4″/86.8 kpc in all images. Left panel: observed image. Middle panel: model image. Right panel: residual image smoothed over 3 px. |
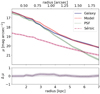 |
Fig. 31. Radial surface brightness profile plot of SDSS J125635.89+500852.4. The galaxy component is plotted with a blue line, the model component is plotted with a dashed red line, the PSF component is plotted with a dotted green line, and the Sérsic component is plotted with a dashed pink line. The shaded area surrounding each profile curve depicts the error linked to each component. |
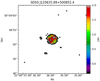 |
Fig. 32. J − Ks colour map of SDSS J125635.89+500852.4. |
4.12. SDSS J150916.18+613716.7
This source is jetted with a distinct detection at 37 GHz (see Table 2), even though it has no earlier detections at other radio frequencies. We used DAOPHOT to model the PSF and obtained the best fit with one PSF and one Sérsic function. The best-fit values can be found in Table 14. Based on the best-fit parameters, we believe that we are modelling the entire galaxy. This is supported by the effective radius being in the range of general radii for disk-like galaxies, and by the Sérsic index around 2 within the errors.
Best-fit parameters of SDSS J150916.18+613716.7.  =
=  .
.
The observed, model, and residual images of the source can be seen in Fig. 33. There are virtually no residuals left in the image, and the reduced  is approximately one. These suggest that the fit is good. In the radial surface brightness profile plot, seen in Fig. 34, the model and the observed image curves are approximately identical. The errors in the other components are very small. The J − Ks colour map of the source is presented in Fig. 35. Unlike the other galaxies in this paper, SDSS J150916.18+613716.7 shows a blue central region with red by the edges of the galaxy. As mentioned earlier, this is probably due to the fact that we were not able to successfully match the PSF sizes of the two images. However, the J − Ks magnitude is within the accepted range for a Seyfert 1 galaxy. Otherwise, this is a small galaxy and it is not possible to determine the structure based on the colour map.
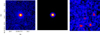 |
Fig. 33. Ks-band images of SDSS J150916.18+613716.7. The FoV is 23.4″/74.8 kpc in all images. Left panel: observed image. Middle panel: model image. Right panel: residual image smoothed over 3 px. |
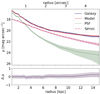 |
Fig. 34. Radial surface brightness profile plot of SDSS J150916.18+613716.7. The galaxy component is plotted with a blue line, the model component is plotted with a dashed red line, the PSF component is plotted with a dotted green line, and the Sérsic component is plotted with a dashed pink line. The shaded area surrounding each profile curve depicts the error linked to each component. |
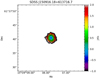 |
Fig. 35. J − Ks colour map of SDSS J150916.18+613716.7. |
5. Discussion
We successfully modelled 12 of the 14 sources. The results are summarised in Table 15. We were unable to properly model 6dFGS gJ044739.0-040330 and 6dFGS gJ084510.2-073205, but upon visual inspection it appears clear that 6dFGS gJ084510.2-073205 is a disk-like galaxy. The data for these sources can be found in Appendix A. Nine out of the 14 sources appear to have disk-like morphology. Two out of the fourteen sources, SDSS J125635.89+500852.4 and SDSS J102906.68+555625.2, do not show clear disk-like morphology based on the best-fit parameters; the Sérsic indices are close to 2.5 with large errors, pushing the value to be one that can also be found in low-luminosity ellipticals. In addition, it is unclear if FBQS J0744+5149 is disk-like or possibly a dwarf. All the clear bulge components we were able to model are pseudo-bulges. This is as expected, as disk-like galaxies tend to have pseudo-bulges, while elliptical galaxies have classical bulges. The frequency of pseudo-bulges in NLS1 galaxies is also higher than the respective frequency in BLS1 galaxies (Orban de Xivry et al. 2011).
Summary of the results.
Our results regarding the morphologies of the NLS1 hosts are in line with previous studies, which have concluded that a large majority of NLS1 nuclei are hosted in disk-like or spiral galaxies with pseudo-bulges (e.g., Crenshaw et al. 2003; Deo et al. 2006; Ohta et al. 2007; Orban de Xivry et al. 2011). What has remained under debate so far is if the host galaxies of jetted NLS1 galaxies are similar to the hosts of their non-jetted counterparts. The number of studied hosts of jetted NLS1 galaxies is finally reaching a number that will allow us to draw significant conclusions, not affected by a lack of statistics. So far, including this study, a total of more than 50 hosts of jetted NLS1 galaxies have been modelled (Antón et al. 2008; León Tavares et al. 2014; Kotilainen et al. 2016; Olguín-Iglesias et al. 2017, 2020; Järvelä et al. 2018; Berton et al. 2019; Hamilton et al. 2021; Vietri et al. 2022), and only two studies have identified elliptical galaxies (D’Ammando et al. 2017; D’Ammando et al. 2018). There is some debate concerning the morphology of FBQS J1644+2619 (D’Ammando et al. 2017; Olguín-Iglesias et al. 2017), but the fact remains that the host galaxies of jetted NLS1 galaxies seem to preferentially be disk-like.
In the early 2000s, it was speculated that the radio-loudness parameter was directly connected to the black hole mass, and thus that relativistic jets could be exclusively launched by black holes with masses above 109 M⊙ (Laor 2000). This conclusion, however, was based on observations of the Palomar-Green (PG) quasar sample, which only included bright objects with high black hole masses, and thus it was biased. It is now clear that relativistic jets are instead a ubiquitous phenomenon that can occur over a wide mass range, and NLS1 galaxies are the most evident proof of this (Foschini 2011). The power of relativistic jets scales non-linearly with the black hole mass (Heinz & Sunyaev 2003), among some other factors. Therefore, low-mass sources have less luminous jets that eluded early surveys. After the discovery of relativistic jets in NLS1 galaxies, some authors tried to reconcile the large mass paradigm by claiming that NLS1 galaxies are not genuinely low-mass sources, but instead that they have rather massive black holes and a flattened BLR observed pole-on (Calderone et al. 2013). Whereas this could be the case for a few jetted NLS1 galaxies, based on the current evidence it does not seem to be a plausible explanation for all of them. A strong argument against this hypothesis are the host morphologies of jetted NLS1 galaxies, since it is commonly known that disk-like galaxies in general harbour less massive central black holes than elliptical galaxies(Hu 2008), where the most luminous quasars are found. Among the sources in our sample, the black hole masses vary between 3.3×10⁵ M⊙ and 5.0×10⁸ M⊙, a typical range for NLS1 galaxies, with two sources exceeding 108 M⊙. The recent studies seem to unquestionably confirm that the jet paradigm is not valid and that the black hole mass is not a determining factor in launching of the relativistic jets.
In addition to disproving the jet paradigm, the jetted NLS1 galaxies also force us to revise the AGN unification models. Narrow-line Seyfert 1 galaxies were traditionally placed among the radio-quiet, non-jetted population of AGNs, but with the number of jetted NLS1 galaxies soon reaching 100, they can no longer be treated simply as a curiosity. Since they are not similar to more powerful jetted AGNs either, a new unification model for unevolved AGNs – with and without jets – was proposed, and it was hypothesised that jetted NLS1 galaxies, as high-excitation AGNs, are similar to the progenitors of FSRQs (Berton et al. 2017). However, many questions still remain open; for example, it is still unclear if all NLS1 galaxies should even be treated as one population of sources and what the future evolution of the sub-classes of NLS1 galaxies will be.
It is known that the environment in which the galaxy resides plays a role in its evolution, as well as the level of the nuclear activity. The most powerful and evolved AGNs, such as blazars, usually reside in the densest environments, such as super-clusters, whereas less evolved AGNs, including Seyfert galaxies, favour the less dense parts, residing in voids and intermediate-density regions (e.g., Lietzen et al. 2011). It has also been speculated that within the NLS1 population the jetted NLS1 galaxies prefer denser large-scale environments than their non-jetted counterparts (Järvelä et al. 2017), highlighting the possibility that mergers and interaction, which are more likely to take place in a denser environment, might be important for the launching of the jets. We have the large-scale environment data for seven of our sources, obtained from (Järvelä et al. 2017; see Table 15). Of these seven sources, two sources reside in a void, four sources in a super-cluster, and one source in an intermediate-density region. All of the sources that we have the large-scale environment data for most likely harbour a powerful relativistic jet. The data is not conclusive, as the sample sizes are still too small, but it seems that whereas the jetted NLS1 galaxies might slightly favour denser environments, the large-scale environment is not a determining factor in the triggering of the jets.
More important for the evolution of an AGN than the large-scale environment is its nearby, group- and galaxy-scale, environment, as this can efficiently reshape the galaxy and its dynamics. While the role of interaction and mergers in the overall AGN scheme is still unclear, it was earlier speculated that there could be a connection between mergers or interaction and jetted NLS1 galaxies (e.g., Järvelä et al. 2018; Olguín-Iglesias et al. 2020; Berton et al. 2021). However, only one of our jetted sources exhibit possible interaction. The lack of interacting sources might be partly due to the limitations of resolution in our study, and especially minor mergers, also able to trigger nuclear activity, could easily go unnoticed. A noteworthy example of this is the case of IRAS 17020+4544, a jetted NLS1 that does not show any evidence of merging in optical or NIR imaging, but revealed signs of a small companion galaxy only with observations of its molecular gas (Salomé et al. 2021; Järvelä et al. 2022). Furthermore, Olguín-Iglesias et al. (2020) found signs of minor mergers in a larger fraction of their γ-ray-emitting NLS1 galaxies (75%) than non-γ radio-loud NLS1 galaxies (53%). They also find that the bulges of γ-NLS1 galaxies show red NIR colours (J − K ∼ 2), clearly distinct from their hosts, whereas the bulge colours of the non-γ sources are comparable to their hosts. They attribute the red nuclei to a dust-embedded AGN, or, alternatively, the bulge exhibiting enhanced star formation. A similar trend is seen in our jetted NLS1 galaxies as all but one of them show a clearly redder nucleus than the rest of the galaxy. If the hypothesis of Olguín-Iglesias et al. (2020) is correct, this might be a sign of past minor mergers in these sources. However, in our case, the nuclei of the likely non-jetted NLS1 galaxies are also redder than their host galaxies. The role of mergers in the evolution of jetted NLS1 galaxies remains unclear, but based on the results so far, it looks like at least major mergers are not required for triggering relativistic jets in NLS1 galaxies. In the future, higher-resolution data of larger samples are required to investigate the impact of mergers in the development of the NLS1 population.
6. Conclusions
We observed 14 NLS1 galaxies in J- and Ks-bands with NOT with the aim to determine their host galaxy morphologies, and we investigated whether they exhibit any signs of interaction. In addition, we obtained J − Ks colour maps for 13 sources observed in both bands to study mainly the properties of the nucleus, and any additional hints regarding the composition of the host galaxies. Our main conclusions are the following:
-
The large majority of jetted NLS1 galaxies – in this study, and in general – are proven to be hosted in disk-like galaxies.
-
Our results confirm that large elliptical galaxies are not needed for launching and maintaining relativistic jets. As proven by this and previous studies, the jet paradigm is undoubtedly inaccurate and needs to be reassessed based on recent evidence.
-
Although previously speculated otherwise, major mergers might not be the driving factor in the launching of powerful relativistic jets – at least in NLS1 galaxies.
-
The cores of the jetted NLS1 galaxies are, as expected, red, possibly due to dust extinction, suggesting that these sources might have recently undergone minor mergers.
With this and previous studies, the sample size of jetted NLS1 galaxies with known host morphologies is finally reaching a number suitable for statistically significant and reliable results. However, higher-resolution observations, for example, using the Very Large Telescope or the James Webb Space Telescope, are still needed to properly model all the components of the hosts, and to study the sources at higher redshift. In addition, observations at different wavelengths, such as sub-millimetre observations with the Atacama Large Millimeter Array, might help in assessing the frequency and role of interaction and mergers in jetted NLS1 galaxies. With NLS1 galaxies being in an early evolutionary stage, they can be a crucial factor in understanding the evolution of jetted AGNs and an ideal laboratory for studying AGN feedback. Furthermore, if jetted NLS1 galaxies are similar to the progenitors of FSRQs, further studies of NLS1 galaxies can help estimate the impact of kinematically young jetted AGNs on the galaxy4 evolution in the early Universe.
Radio-loudness, abbreviated R, in astronomy is defined as the ratio of the radio flux density at 5 GHz and the optical flux density in the B band Kellermann et al. (1989).
Acknowledgments
IRAF is distributed by the National Optical Astronomy Observatories, which are operated by the Association of Universities for Research in Astronomy, Inc., under cooperative agreement with the National Science Foundation. Our observations were made with the Nordic Optical Telescope, operated by the Nordic Optical Telescope Scientific Association at the Observatorio del Roque de los Muchachos, La Palma, Spain, of the Instituto de Astrofisica de Canarias. The data presented here were obtained in part with ALFOSC, which is provided by the Instituto de Astrofisica de Andalucia (IAA) under a joint agreement with the University of Copenhagen and NOT. This research has made use of GALFIT. This publication made use of the SIMBAD database, operated at CDS, Strasbourg, France. This research has made use of the NASA/IPAC Extragalactic Database (NED), which is operated by the Jet Propulsion Laboratory, California Institute of Technology, under contract with the National Aeronautics and Space Administration. This research made use of Astropy, a community-developed core Python package for Astronomy (Astropy Collaboration 2013, 2018). This publication makes use of data obtained at Metsähovi Radio Observatory, operated by Aalto University, Finland. I.V. would like to thank both the Finnish Cultural Foundation and the Vilho, Yrjö and Kalle Väisälä Foundation of the Finnish Academy of Science and Letters for their support. E.J. is a current European Space Agency Science Research Fellow. M.B. is an ESO fellow. E.C. acknowledges support from ANID BASAL projects ACE210002 and FB210003.
References
- Abdo, A. A., Ackermann, M., Ajello, M., et al. 2009a, ApJ, 699, 976 [CrossRef] [Google Scholar]
- Abdo, A. A., Ackermann, M., Ajello, M., et al. 2009b, ApJ, 707, 727 [NASA ADS] [CrossRef] [Google Scholar]
- Antón, S., Browne, I. W. A., & Marchã, M. J. 2008, A&A, 490, 583 [NASA ADS] [CrossRef] [EDP Sciences] [Google Scholar]
- Astropy Collaboration (Robitaille, T. P., et al.) 2013, A&A, 558, A33 [NASA ADS] [CrossRef] [EDP Sciences] [Google Scholar]
- Astropy Collaboration (Price-Whelan, A. M., et al.) 2018, AJ, 156, 123 [Google Scholar]
- Barth, A. J., Bentz, M. C., Greene, J. E., & Ho, L. C. 2008, ApJ, 683, L119 [NASA ADS] [CrossRef] [Google Scholar]
- Berton, M., & Järvelä, E. 2021, Universe, 7, 188 [NASA ADS] [CrossRef] [Google Scholar]
- Berton, M., Foschini, L., Caccianiga, A., et al. 2017, Front. Astron. Space Sci., 4, 8 [NASA ADS] [CrossRef] [Google Scholar]
- Berton, M., Congiu, E., Järvelä, E., et al. 2018, A&A, 614, A87 [NASA ADS] [CrossRef] [EDP Sciences] [Google Scholar]
- Berton, M., Congiu, E., Ciroi, S., et al. 2019, AJ, 157, 48 [NASA ADS] [CrossRef] [Google Scholar]
- Berton, M., Järvelä, E., Crepaldi, L., et al. 2020, A&A, 636, A64 [NASA ADS] [CrossRef] [EDP Sciences] [Google Scholar]
- Berton, M., Peluso, G., Marziani, P., et al. 2021, A&A, 654, A125 [NASA ADS] [CrossRef] [EDP Sciences] [Google Scholar]
- Boroson, T. 2005, AJ, 130, 381 [NASA ADS] [CrossRef] [Google Scholar]
- Boroson, T. A., & Green, R. F. 1992, ApJ, 80, 109 [NASA ADS] [Google Scholar]
- Caccianiga, A., Antón, S., Ballo, L., et al. 2015, MNRAS, 451, 1795 [NASA ADS] [CrossRef] [Google Scholar]
- Calderone, G., Ghisellini, G., Colpi, M., & Dotti, M. 2013, MNRAS, 431, 210 [NASA ADS] [CrossRef] [Google Scholar]
- Carniani, S., Marconi, A., Maiolino, R., et al. 2016, A&A, 591, A28 [NASA ADS] [CrossRef] [EDP Sciences] [Google Scholar]
- Chen, S., Berton, M., La Mura, G., et al. 2018, A&A, 615, A167 [NASA ADS] [CrossRef] [EDP Sciences] [Google Scholar]
- Cisternas, M., Jahnke, K., Inskip, K. J., et al. 2011, ApJ, 726, 57 [NASA ADS] [CrossRef] [Google Scholar]
- Corbin, M. R. 2000, ApJ, 536, L73 [NASA ADS] [CrossRef] [Google Scholar]
- Cracco, V., Ciroi, S., Berton, M., et al. 2016, MNRAS, 462, 1256 [NASA ADS] [CrossRef] [Google Scholar]
- Crenshaw, D. M., Kraemer, S. B., & Gabel, J. R. 2003, AJ, 126, 1690 [NASA ADS] [CrossRef] [Google Scholar]
- D’Ammando, F., Acosta-Pulido, J. A., Capetti, A., et al. 2017, MNRAS, 469, L11 [CrossRef] [Google Scholar]
- D’Ammando, F., Acosta-Pulido, J. A., Capetti, A., et al. 2018, MNRAS, 478, L66 [NASA ADS] [Google Scholar]
- Decarli, R., Dotti, M., Fontana, M., & Haardt, F. 2008, MNRAS, 386, L15 [NASA ADS] [Google Scholar]
- Deo, R. P., Crenshaw, D. M., & Kraemer, S. B. 2006, AJ, 132, 321 [NASA ADS] [CrossRef] [Google Scholar]
- Du, P., & Wang, J.-M. 2019, ApJ, 886, 42 [NASA ADS] [CrossRef] [Google Scholar]
- Du, P., Brotherton, M. S., Wang, K., et al. 2018, ApJ, 869, 142 [CrossRef] [Google Scholar]
- Elmegreen, D. M., & Elmegreen, B. G. 2014, ApJ, 781, 11 [Google Scholar]
- Fabian, A. C. 2012, ARA&A, 50, 455 [Google Scholar]
- Fisher, D. B., & Drory, N. 2008, AJ, 136, 773 [NASA ADS] [CrossRef] [Google Scholar]
- Foschini, L. 2011, in Narrow-Line Seyfert 1 Galaxies and their Place in the Universe, eds. L. Foschini, M. Colpi, L. Gallo, et al., Proceedings of Science (PoS, Trieste, Italy), NLS1 [Google Scholar]
- Foschini, L., Fermi/LAT Collaboration, Ghisellini, G., et al. 2010, in Accretion and Ejection in AGN: A Global View, eds. L. Maraschi, G. Ghisellini, R. Della Ceca, & F. Tavecchio, ASP Conf. Ser., 427, 243 [NASA ADS] [Google Scholar]
- Foschini, L., Berton, M., Caccianiga, A., et al. 2015, A&A, 575, A13 [NASA ADS] [CrossRef] [EDP Sciences] [Google Scholar]
- Foschini, L., Berton, M., Caccianiga, A., et al. 2017, A&A, 603, C1 [NASA ADS] [CrossRef] [EDP Sciences] [Google Scholar]
- Ganci, V., Marziani, P., D’Onofrio, M., et al. 2019, A&A, 630, A110 [NASA ADS] [CrossRef] [EDP Sciences] [Google Scholar]
- Goodrich, R. W. 1989, ApJ, 342, 224 [Google Scholar]
- Graham, A. W., & Driver, S. P. 2005, PASA, 22, 118 [NASA ADS] [CrossRef] [Google Scholar]
- Hamilton, T. S., Berton, M., Antón, S., et al. 2021, MNRAS, 504, 5188 [NASA ADS] [CrossRef] [Google Scholar]
- Heinz, S., & Sunyaev, R. A. 2003, MNRAS, 343, L59 [Google Scholar]
- Hu, J. 2008, MNRAS, 386, 2242 [CrossRef] [Google Scholar]
- Jarrett, T. H. 2000, PASP, 112, 1008 [NASA ADS] [CrossRef] [Google Scholar]
- Järvelä, E. 2018, Doctoral Thesis, School of Electrical Engineering [Google Scholar]
- Järvelä, E., Lähteenmäki, A., & Léon-Tavares, J. 2015, A&A, 573, A76 [NASA ADS] [CrossRef] [EDP Sciences] [Google Scholar]
- Järvelä, E., Lähteenmäki, A., Lietzen, H., et al. 2017, A&A, 606, A9 [NASA ADS] [CrossRef] [EDP Sciences] [Google Scholar]
- Järvelä, E., Lähteenmäki, A., & Berton, M. 2018, A&A, 619, A69 [NASA ADS] [CrossRef] [EDP Sciences] [Google Scholar]
- Järvelä, E., Dahale, R., Crepaldi, L., et al. 2022, A&A, 658, A12 [NASA ADS] [CrossRef] [EDP Sciences] [Google Scholar]
- Kellermann, K. I., Sramek, R., Schmidt, M., Shaffer, D. B., & Green, R. 1989, AJ, 98, 1195 [Google Scholar]
- Komossa, S., Voges, W., Xu, D., et al. 2006, AJ, 132, 531 [NASA ADS] [CrossRef] [Google Scholar]
- Kotilainen, J. K., León-Tavares, J., Olguín-Iglesias, A., et al. 2016, ApJ, 832, 157 [CrossRef] [Google Scholar]
- Krongold, Y., Dultzin-Hacyan, D., & Marziani, P. 2001, AJ, 121, 702 [NASA ADS] [CrossRef] [Google Scholar]
- Lähteenmäki, A., Järvelä, E., Hovatta, T., et al. 2017, A&A, 603, A100 [NASA ADS] [CrossRef] [EDP Sciences] [Google Scholar]
- Lähteenmäki, A., Järvelä, E., Ramakrishnan, V., et al. 2018, A&A, 614, L1 [NASA ADS] [CrossRef] [EDP Sciences] [Google Scholar]
- Laor, A. 2000, ApJ, 543, L111 [NASA ADS] [CrossRef] [Google Scholar]
- León Tavares, J., Kotilainen, J., Chavushyan, V., et al. 2014, ApJ, 795, 58 [Google Scholar]
- Lietzen, H., Heinämäki, P., Nurmi, P., et al. 2011, A&A, 535, A21 [NASA ADS] [CrossRef] [EDP Sciences] [Google Scholar]
- MacLeod, C. L., Ivezić, Ž., Sesar, B., et al. 2012, ApJ, 753, 106 [NASA ADS] [CrossRef] [Google Scholar]
- Marziani, P., Dultzin, D., Sulentic, J. W., et al. 2018, Front. Astron. Space Sci., 5, 6 [CrossRef] [Google Scholar]
- Mathur, S. 2000, MNRAS, 314, L17 [NASA ADS] [CrossRef] [Google Scholar]
- Mathur, S., Fields, D., Peterson, B. M., & Grupe, D. 2012, ApJ, 754, 146 [NASA ADS] [CrossRef] [Google Scholar]
- Ohta, K., Aoki, K., Kawaguchi, T., & Kiuchi, G. 2007, ApJS, 169, 1 [NASA ADS] [CrossRef] [Google Scholar]
- Olguín-Iglesias, A., Kotilainen, J. K., León Tavares, J., Chavushyan, V., & Añorve, C. 2017, MNRAS, 467, 3712 [NASA ADS] [Google Scholar]
- Olguín-Iglesias, A., Kotilainen, J., & Chavushyan, V. 2020, MNRAS, 492, 1450 [Google Scholar]
- Orban de Xivry, G., Davies, R., Schartmann, M., et al. 2011, MNRAS, 417, 2721 [NASA ADS] [CrossRef] [Google Scholar]
- Osterbrock, D. E., & Pogge, R. W. 1985, ApJ, 297, 166 [Google Scholar]
- Paliya, V. S., Ajello, M., Rakshit, S., et al. 2018, ApJ, 853, L2 [NASA ADS] [CrossRef] [Google Scholar]
- Paliya, V. S., Parker, M. L., Jiang, J., et al. 2019, ApJ, 872, 169 [NASA ADS] [CrossRef] [Google Scholar]
- Peng, C. Y., Ho, L. C., Impey, C. D., & Rix, H.-W. 2010, AJ, 139, 2097 [Google Scholar]
- Peterson, B. M. 2011, ArXiv e-prints [arXiv:1109.4181] [Google Scholar]
- Pović, M., Sánchez-Portal, M., Pérez García, A. M., et al. 2012, A&A, 541, A118 [NASA ADS] [CrossRef] [EDP Sciences] [Google Scholar]
- Romano, P., Vercellone, S., Foschini, L., et al. 2018, MNRAS, 481, 5046 [NASA ADS] [CrossRef] [Google Scholar]
- Salo, H., Laurikainen, E., Laine, J., et al. 2015, ApJS, 219, 4 [Google Scholar]
- Salomé, Q., Longinotti, A. L., Krongold, Y., et al. 2021, MNRAS, 501, 219 [Google Scholar]
- Sani, E., Lutz, D., Risaliti, G., et al. 2010, MNRAS, 403, 1246 [Google Scholar]
- Sbarrato, T., Ghisellini, G., Giovannini, G., & Giroletti, M. 2021, A&A, 655, A95 [NASA ADS] [CrossRef] [EDP Sciences] [Google Scholar]
- Spergel, D. N., Bean, R., Doré, O., et al. 2007, ApJS, 170, 377 [NASA ADS] [CrossRef] [Google Scholar]
- Stetson, P. B. 1987, PASP, 99, 191 [Google Scholar]
- Tortosa, A., Ricci, C., Tombesi, F., et al. 2022, MNRAS, 509, 3599 [Google Scholar]
- Urrutia, T., Lacy, M., & Becker, R. H. 2008, ApJ, 674, 80 [Google Scholar]
- van de Ven, G., & Fathi, K. 2010, ApJ, 723, 767 [NASA ADS] [CrossRef] [Google Scholar]
- Vietri, A., Järvelä, E., Berton, M., et al. 2022, A&A, 662, A20 [NASA ADS] [CrossRef] [EDP Sciences] [Google Scholar]
- Wang, F., Du, P., Hu, C., et al. 2016, ApJ, 824, 149 [CrossRef] [Google Scholar]
- Winkel, N., Husemann, B., Davis, T. A., et al. 2022, A&A, 663, A104 [NASA ADS] [CrossRef] [EDP Sciences] [Google Scholar]
- Yuan, W., Zhou, H. Y., Komossa, S., et al. 2008, ApJ, 685, 801 [NASA ADS] [CrossRef] [Google Scholar]
- Zamanov, R., Marziani, P. W., Sulentic, J., et al. 2002, ApJ, 576, 9 [Google Scholar]
- Zhou, H., Wang, T., Yuan, W., et al. 2006, ApJ, 166, 128 [NASA ADS] [Google Scholar]
Appendix A: Compromised fits
We were unable to properly model two of our sources: 6dFGS gJ044739.0-040330 and 6dFGS gJ084510.2-073205. Both of these sources suffered from at least one of the following: high redshift or high complexity. We plotted a radial surface brightness plot for the sources for which we were able to obtain a physically meaningful plot. An intensity image is given of the possible components.
A.1. 6dFGS gJ044739.0-040330
This is one of the three sources that have not been detected at 37 GHz or any other radio frequency. For the PSF, we chose a star directly from the image. We tried to model the source with one PSF and two Sérsic functions. The best-fit values can be found in Table A.1. We also modelled a nearby source inside the fitting region with a PSF and a Sérsic component.
Best-fit parameters of 6dFGS gJ044739.0-040330.  = 1.816.
Our source and the nearby source are so close to each other that it appeared this could be a merger. To study the possible companion galaxy, we applied for additional observing time with Andalucia Faint Object Spectrograph and Camera (ALFOSC) at NOT to obtain its spectrum and redshift (proposal ID 63-409, PI I. Björklund). It turned out that the companion is actually a star in the Galaxy and not a physical companion of 6dFGS gJ044739.0-040330.
Because our source is too close to the star, we were unable to obtain a proper fit, and we therefore only present the observed image, seen in Fig. A.1. The J − Ks colour map of the source is shown in Fig. A.2. The central region of 6dFGS gJ044739.0-040330 has J − Ks magnitude of approximately 2, meaning that it is very red, suggesting dust extinction. The rest of the galaxy has J − Ks magnitude close to 1. There is no evident structure visible in the map. Unlike the AGN, the companion source is very yellow (J − Ks ∼ 0.5), supporting the conclusion that it is a star and not part of the galaxy.
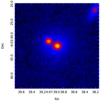 |
Fig. A.1. Ks-band images of SDSS 6dFGS gJ044739.0-040330. Observed image of the source. The FoV is 23.4″/ 34.5 kpc in the image. |
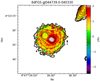 |
Fig. A.2. J − Ks colour map of 6dFGS gJ044739.0-040330. |
A.2. 6dFGS gJ084510.2-073205
This is another of the three sources not detected at 37 GHz, nor, in fact, any other radio frequency. A visual inspection of this source suggests that the source has at least a disk and a bulge component. The PSF model for this source was created from a star directly from the image. The best fit we were able to obtain had one PSF component and two Sérsic components. The values are listed in Table A.2. The obtained parameters, however, were not physically meaningful. This was unexpected, as the redshift of this source is only ∼0.10 and the seeing was tolerable, even though not particularly good.
Best-fit parameters of 6dFGS gJ084510.2-073205.  = 0.808.
The observed, model, and the residual image of the source can be seen in Fig. A.3. There are a lot of residuals left, and the model image is very simplified compared to the observed image, meaning that we were unable to model the source adequately. The residuals, especially in the nucleus, and the fit parameters hint at a possible issue with the PSF. The radial surface brightness profile plot of the galaxy is shown in Fig. A.5 and the J − Ks colour map in Fig. A.4. This galaxy is extremely red (J − Ks magnitude ∼2), with very little of anything else visible in the map. Although this galaxy is large, the poor data quality makes it difficult to distinguish any clear structures in the colour map.
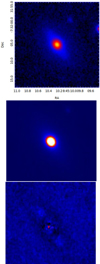 |
Fig. A.3. Ks-band images of 6dFGS gJ084510.2-073205. The FoV is 23.4″/ 42.8 kpc in all images. Top panel: Observed image. Middle panel: Model image. Bottom panel: Residual image smoothed over 3px. |
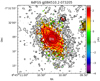 |
Fig. A.4. J − Ks colour map of 6dFGS gJ084510.2-073205. |
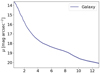 |
Fig. A.5. Radial surface brightness profile plot of 6dFGS gJ084510.2-073205. The galaxy component is modelled with a blue line. The shaded area surrounding the profile curve depicts the error linked to the component. |
All Tables
All Figures
|
Fig. 1. J-band images of 6dFGS gJ042021.7-053054. The FoV is 23.4″/74.1 kpc in all images. Left panel: observed image. Middle panel: model image. Right panel: residual image smoothed over 3 px. |
| In the text | |
|
Fig. 2. Radial surface brightness profile plot of 6dFGS gJ042021.7−053054. The galaxy component is plotted with a blue line, the model component is plotted with a dashed red line, the PSF component is plotted with a dotted green line, and the Sérsic component is plotted with a dashed pink line. The shaded area surrounding each profile curve depicts the error linked to each component. |
| In the text | |
|
Fig. 3. J − Ks colour map of 6dFGS gJ042021.7-053054. |
| In the text | |
|
Fig. 4. J-band images of FBQS J0744+5149. The FoV is 15.0″/84.6 kpc in all images. Left panel: observed image. Middle panel: model image. Right panel: residual image smoothed over 3 px. |
| In the text | |
|
Fig. 5. Radial surface brightness profile plot of FBQS J0744+5149. The galaxy component is plotted with a blue line, the model component is plotted with a dashed red line, the PSF component is plotted with a dotted green line, the Sérsic 1 component is plotted with a dashed pink line, and finally the Sérsic 2 component is plotted with a dotted light blue line. The shaded area surrounding each profile curve depicts the error linked to each component. |
| In the text | |
|
Fig. 6. J − Ks colour map of FBQS J0744+5149. |
| In the text | |
|
Fig. 7. J-band images of SDSS J080535.16+302201.7. The FoV is 23.4″/145.6 kpc in all images. Left panel: observed image. Middle panel: model image. Right panel: residual image smoothed over 3 px. |
| In the text | |
|
Fig. 8. Radial surface brightness profile plot of SDSS J080535.16+302201.7. The galaxy component is plotted with a blue line, the model component is plotted with a dashed red line, the PSF component is plotted with a dotted green line, and the Sérsic component is plotted with a dashed pink line. The shaded area surrounding each profile curve depicts the error linked to each component. |
| In the text | |
|
Fig. 9. J − Ks colour map of SDSS J080535.16+302201.7. |
| In the text | |
|
Fig. 10. Ks-band images of SDSS J084516.17+421129.9. The FoV is 5.9″/35.5 kpc in all images. Left panel: observed image. Middle panel: model image. Right panel: residual image smoothed over 3 px. |
| In the text | |
|
Fig. 11. Radial surface brightness profile plot of SDSS J084516.17+421129.9. The galaxy component is plotted with a blue line, the model component is plotted with a dashed red line, the PSF component is plotted with a dotted green line, and the Sérsic component is plotted with a dashed pink line. The shaded area surrounding each profile curve depicts the error linked to each component. |
| In the text | |
|
Fig. 12. J − Ks colour map of SDSS J084516.17+421129.9. |
| In the text | |
|
Fig. 13. Ks-band images of SDSS J090113.23+465734.7. The FoV is 5.9″/31.8 pc in all images. Left panel: observed image. Middle panel: model image. Right panel: residual image smoothed over 3 px. |
| In the text | |
|
Fig. 14. Radial surface brightness profile plot of J090113.23+465734.7. The galaxy component is plotted with a blue line, the model component is plotted with a dashed red line, the PSF component is plotted with a dotted green line, and the Sérsic 1 component is plotted with a dashed pink line. The shaded area surrounding each profile curve depicts the error linked to each component. |
| In the text | |
|
Fig. 15. J − Ks colour map of J090113.23+465734.7. |
| In the text | |
|
Fig. 16. Ks-band images of SDSS J093712.32+500852.1. The FoV is 5.9″/23.7 kpc in all images. Left panel: observed image. Middle panel: model image. Right panel: residual image smoothed over 3px. |
| In the text | |
|
Fig. 17. Radial surface brightness profile plot of SDSS J093712.32+500852.1. The galaxy component is plotted with a blue line, the model component is plotted with a dashed red line, the PSF component is plotted with a dotted green line, and the Sérsic component is plotted with a dashed pink line. The shaded area surrounding each profile curve depicts the error linked to each component. |
| In the text | |
|
Fig. 18. J − Ks colour map of SDSS J093712.32+500852.1. |
| In the text | |
|
Fig. 19. Ks-band images of SDSS J102906.68+555625.2. The FoV is 8.4″/47.0 kpc in all images. Left panel: observed image. Middle panel: model image. Right panel: residual image smoothed over 3px. |
| In the text | |
|
Fig. 20. Radial surface brightness profile plot of SDSS J102906.68+555625.2. The galaxy component is plotted with a blue line, the model component is plotted with a dashed red line, the PSF component is plotted with a dotted green line, and the Sérsic component is plotted with a dashed pink line. The shaded area surrounding the profile curve depicts the error linked to the component. |
| In the text | |
|
Fig. 21. Ks-band images of SDSS J103123.73+423439.2. The FoV is 23.4″/117.1 kpc in all images. Left panel: observed image. Middle panel: model image. Right panel: residual image smoothed over 3 px. |
| In the text | |
|
Fig. 22. Radial surface brightness profile plot of SDSS J103123.73+423439.2. The galaxy component is plotted with a blue line, the model component is plotted with a dashed red line, the PSF component is plotted with a dotted green line, and the Sérsic component is plotted with a dashed pink line. The shaded area surrounding each profile curve depicts the error linked to each component. |
| In the text | |
|
Fig. 23. J − Ks colour map of SDSS J103123.73+423439.2. |
| In the text | |
|
Fig. 24. Ks-band images of SDSS J122844.81+501751.2. The FoV is 23.4″/91.5 kpc in all images. Left panel: observed image. Middle panel: model image. Right panel: residual image smoothed over 3 px. |
| In the text | |
|
Fig. 25. Radial surface brightness profile plot of SDSS J122844.81+501751.2. The galaxy component is plotted with a blue line, the model component is plotted with a dashed red line, the PSF component is plotted with a dotted green line, the Sérsic 1 component is plotted with a dashed pink line, and finally the Sérsic 2 component is plotted with a dotted light blue line. The shaded area surrounding each profile curve depicts the error linked to each component. |
| In the text | |
|
Fig. 26. J − Ks colour map of SDSS J122844.81+501751.2. |
| In the text | |
|
Fig. 27. Ks-band images of SDSS J123220.11+495721.8. The FoV is 23.4″/91.3 kpc in all images. Left panel: observed image. Middle panel: model image. Right panel: residual image smoothed over 3 px. |
| In the text | |
|
Fig. 28. Radial surface brightness profile plot of SDSS J123220.11+495721.8. The galaxy component is plotted with a blue line, the model component is plotted with a dashed red line, the PSF component is plotted with a dotted green line, the Sérsic 1 component is plotted with a dashed pink line, and finally the Sérsic 2 component is plotted with a dotted light blue line. The shaded area surrounding each profile curve depicts the error linked to each component. |
| In the text | |
|
Fig. 29. J − Ks colour map of SDSS J123220.11+495721.8. |
| In the text | |
|
Fig. 30. Ks-band images of SDSS J125635.89+500852.4. The FoV is 23.4″/86.8 kpc in all images. Left panel: observed image. Middle panel: model image. Right panel: residual image smoothed over 3 px. |
| In the text | |
|
Fig. 31. Radial surface brightness profile plot of SDSS J125635.89+500852.4. The galaxy component is plotted with a blue line, the model component is plotted with a dashed red line, the PSF component is plotted with a dotted green line, and the Sérsic component is plotted with a dashed pink line. The shaded area surrounding each profile curve depicts the error linked to each component. |
| In the text | |
|
Fig. 32. J − Ks colour map of SDSS J125635.89+500852.4. |
| In the text | |
|
Fig. 33. Ks-band images of SDSS J150916.18+613716.7. The FoV is 23.4″/74.8 kpc in all images. Left panel: observed image. Middle panel: model image. Right panel: residual image smoothed over 3 px. |
| In the text | |
|
Fig. 34. Radial surface brightness profile plot of SDSS J150916.18+613716.7. The galaxy component is plotted with a blue line, the model component is plotted with a dashed red line, the PSF component is plotted with a dotted green line, and the Sérsic component is plotted with a dashed pink line. The shaded area surrounding each profile curve depicts the error linked to each component. |
| In the text | |
|
Fig. 35. J − Ks colour map of SDSS J150916.18+613716.7. |
| In the text | |
|
Fig. A.1. Ks-band images of SDSS 6dFGS gJ044739.0-040330. Observed image of the source. The FoV is 23.4″/ 34.5 kpc in the image. |
| In the text | |
|
Fig. A.2. J − Ks colour map of 6dFGS gJ044739.0-040330. |
| In the text | |
|
Fig. A.3. Ks-band images of 6dFGS gJ084510.2-073205. The FoV is 23.4″/ 42.8 kpc in all images. Top panel: Observed image. Middle panel: Model image. Bottom panel: Residual image smoothed over 3px. |
| In the text | |
|
Fig. A.4. J − Ks colour map of 6dFGS gJ084510.2-073205. |
| In the text | |
|
Fig. A.5. Radial surface brightness profile plot of 6dFGS gJ084510.2-073205. The galaxy component is modelled with a blue line. The shaded area surrounding the profile curve depicts the error linked to the component. |
| In the text | |
Current usage metrics show cumulative count of Article Views (full-text article views including HTML views, PDF and ePub downloads, according to the available data) and Abstracts Views on Vision4Press platform.
Data correspond to usage on the plateform after 2015. The current usage metrics is available 48-96 hours after online publication and is updated daily on week days.
Initial download of the metrics may take a while.