Open Access
Fig. A.5.
Download original image
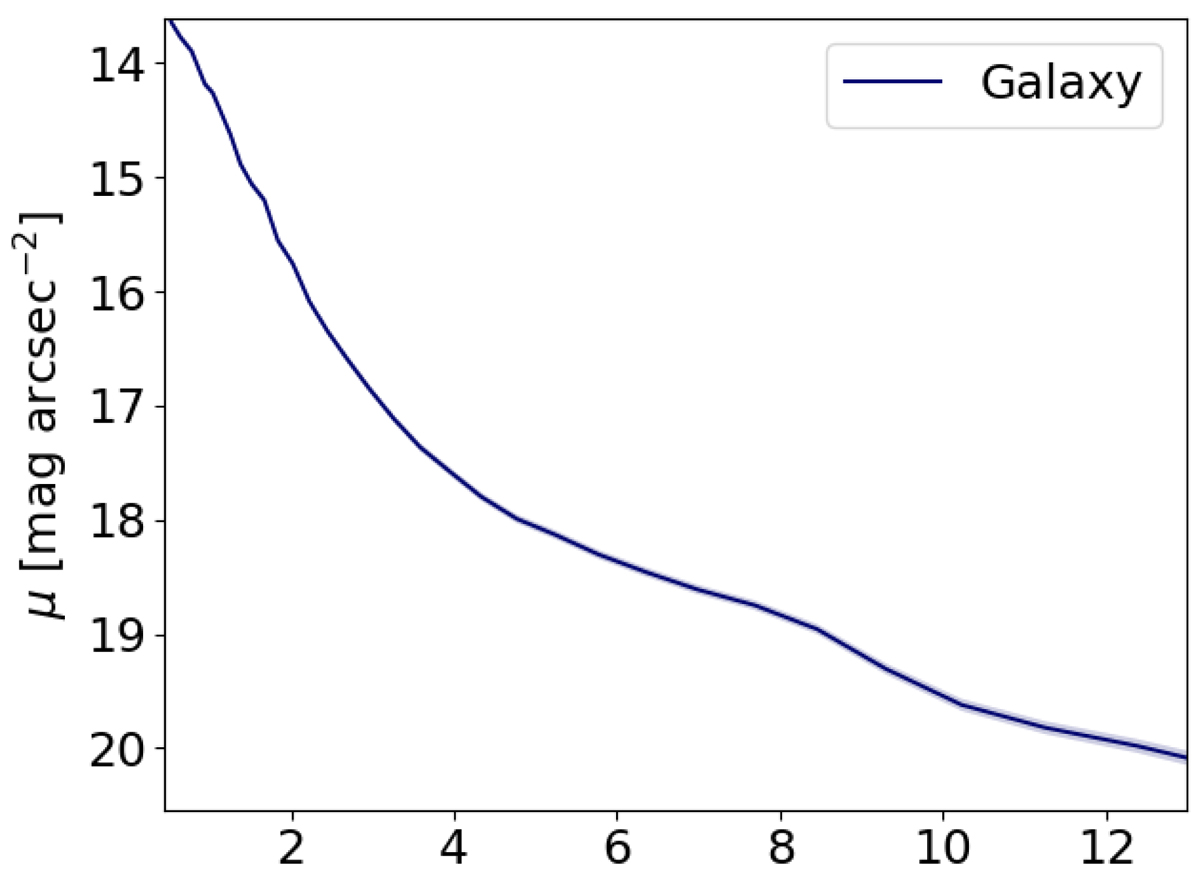
Radial surface brightness profile plot of 6dFGS gJ084510.2-073205. The galaxy component is modelled with a blue line. The shaded area surrounding the profile curve depicts the error linked to the component.
Current usage metrics show cumulative count of Article Views (full-text article views including HTML views, PDF and ePub downloads, according to the available data) and Abstracts Views on Vision4Press platform.
Data correspond to usage on the plateform after 2015. The current usage metrics is available 48-96 hours after online publication and is updated daily on week days.
Initial download of the metrics may take a while.