Fig. 9
Download original image
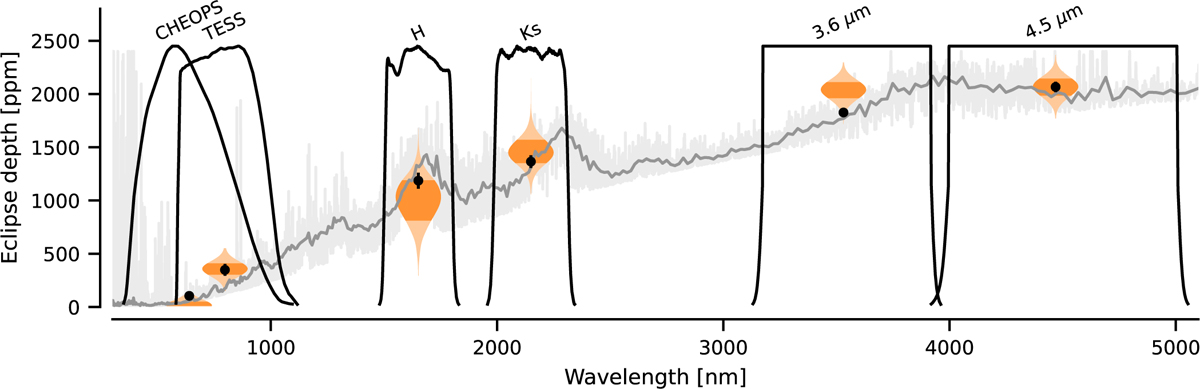
Posterior model spectrum for the retrieval calculations using Helios-r2. The light grey line shows the high-resolution version of the posterior thermal emission model median, and the darker grey line shows the same spectrum in medium resolution. The black points show the retrieval eclipse depths with their corresponding 1σ intervals, and the orange shaded areas show the eclipse depth posteriors estimated from the photometry as given in Table 4. The black labelled lines show the passbands, where the Spitzer passbands are simplified for visualisation.
Current usage metrics show cumulative count of Article Views (full-text article views including HTML views, PDF and ePub downloads, according to the available data) and Abstracts Views on Vision4Press platform.
Data correspond to usage on the plateform after 2015. The current usage metrics is available 48-96 hours after online publication and is updated daily on week days.
Initial download of the metrics may take a while.