Fig. 7
Download original image
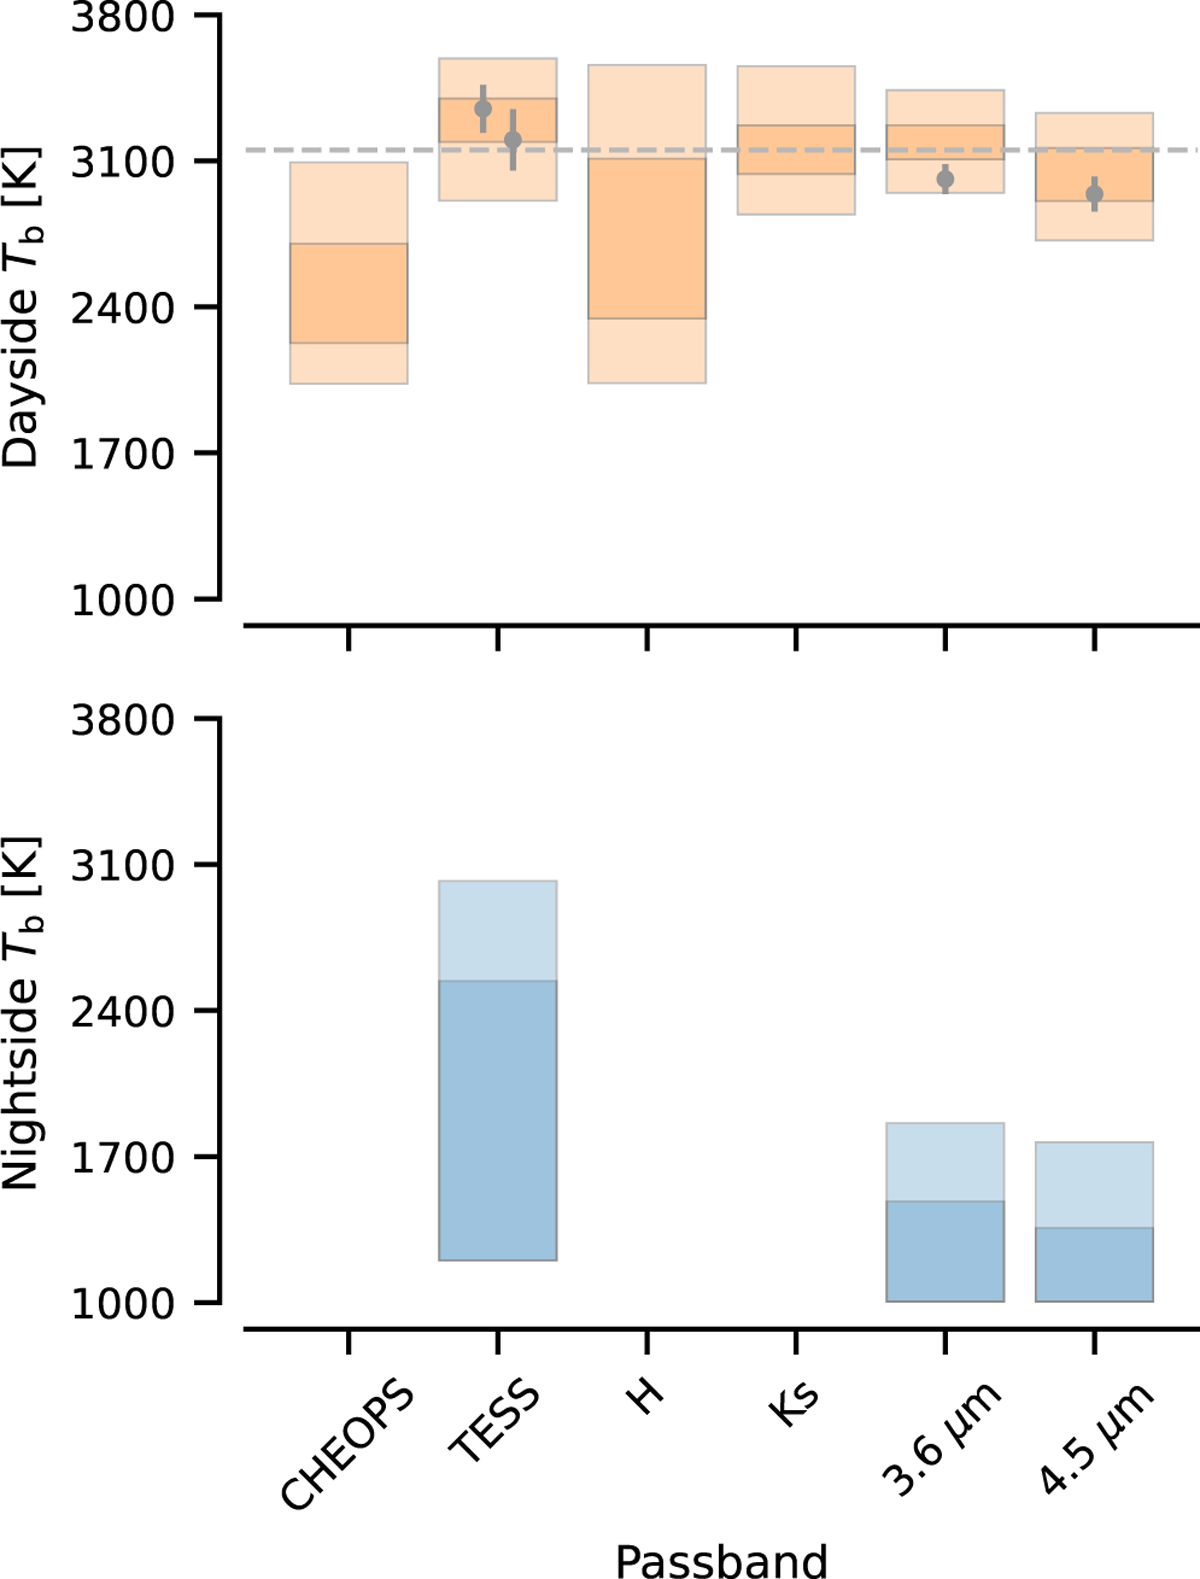
Dayside and nightside brightness temperatures estimated from the flux ratios using the BT-Settl stellar model spectra by Allard (2013). The shading marks the 68% and 99.7% central posterior intervals, from the darkest to the lightest shade, and the dashed horizontal line shows the best-fitting constant brightness temperature. The previous dayside Tb, estimates for the TESS and Spitzer passbands by Beatty et al. (2019, 2020), and von Essen et al. (2021) are shown as points with errorbars.
Current usage metrics show cumulative count of Article Views (full-text article views including HTML views, PDF and ePub downloads, according to the available data) and Abstracts Views on Vision4Press platform.
Data correspond to usage on the plateform after 2015. The current usage metrics is available 48-96 hours after online publication and is updated daily on week days.
Initial download of the metrics may take a while.