Open Access
Fig. 5
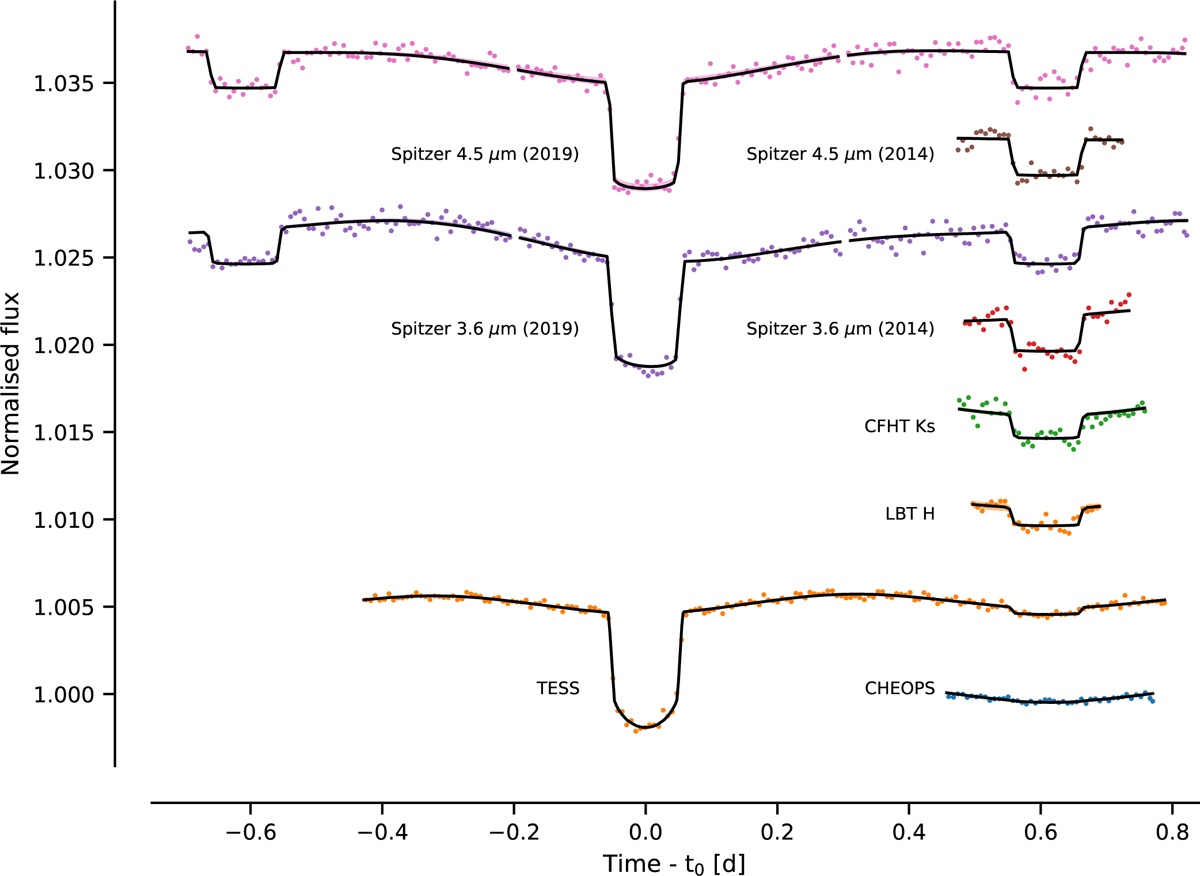
Download original image
Observed light curves from CHEOPS, TESS, LBT, CFHT, and Spitzer (points) and the posterior median phase curve model (black line). The systematics model has been removed from the observations, the TESS and CHEOPS observations have been folded over the phase, and the data has been binned to 10 min for visualisation purposes.
Current usage metrics show cumulative count of Article Views (full-text article views including HTML views, PDF and ePub downloads, according to the available data) and Abstracts Views on Vision4Press platform.
Data correspond to usage on the plateform after 2015. The current usage metrics is available 48-96 hours after online publication and is updated daily on week days.
Initial download of the metrics may take a while.