Fig. 3
Download original image
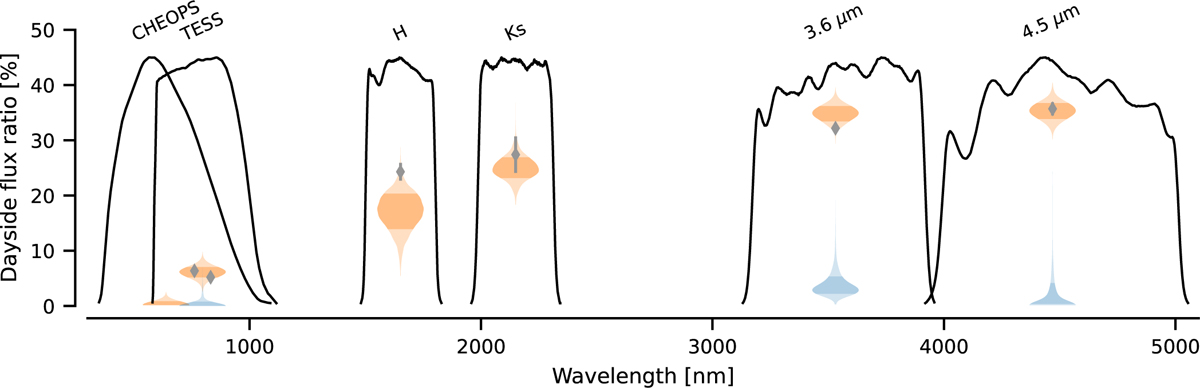
The dayside (orange) and nightside (blue) planet-star flux ratio posterior distributions for all passbands. The central 68% posterior interval is marked with a dark shade and the previous dayside flux ratio estimates are shown as diamonds with errorbars showing their reported uncertainties. For TESS, the Beatty et al. (2020) estimate is shown on the left and the von Essen et al. (2021) estimate on the right.
Current usage metrics show cumulative count of Article Views (full-text article views including HTML views, PDF and ePub downloads, according to the available data) and Abstracts Views on Vision4Press platform.
Data correspond to usage on the plateform after 2015. The current usage metrics is available 48-96 hours after online publication and is updated daily on week days.
Initial download of the metrics may take a while.